White Rabbit Switch noise measurement

I measured the CLK2 10 MHz RF-output of two White Rabbit switches with a Microsemi 3120A. The results are similar to previous results with ADEV(1s)=1.5e-11.

When phase-locked to an external reference clock the long-term stability is obviously much better than when free-running, but for small tau, or high offset-frequency in the phase noise plot, the free running oscillator is actually better.

CONT vs RCON mode on the 53230A frequency counter

This is a follow-up to my earlier notes on the 53230A noise floor.

Naively I did the initial frequency-counting tests using READ?, which is wrong both because it produces data with dead-time and because the consensus for what is meant by Allan deviation assumes pi-counting.

Driven by marketing, no doubt, the 53230A employs internal averaging (something akin to lambda-counting) both with the simple READ? command and the continuous CONT mode mentioned in the manual. Amazingly you have to use the undocumented RCON mode to get pi-counting which will produce correct Allan deviations.

Here is a plot. The opportunity for making errors (with pi- vs. lamda-counting, and gap-free data) is less in time-interval mode, and I have indicated the 12 ps RMS noise floor (1.8e-11/tau in terms of Allan deviation) with a black dashed line. In RCON mode the noise floor has the same 1/tau dependence and I get about 3e-11/tau. If however you simply use the built-in settings of the counter with READ? or CONT you get a noise floor of about 2e-12/sqrt(tau) due to the internal averaging going on behind the scenes.

RCON_vs_CONT

For a paper that explains pi- and lambda-counting see Dawkins2007 (fulltext PDF on ReaserchGate). Enrico Rubiola also has notes on counters.

Datafiles and script for ADEV and figure: 2015-06-18_rcon_cont.zip

Clock display with Python and Tkinter

On github: https://github.com/aewallin/digiclock

clock_display_2015-04-24

A simple clock display with local time, UTC, date (iso8601 format of course!), MJD, day-of-year, and week number. Useful as a permanent info-display in the lab - just make sure your machines are synced with NTP.

1
2
3
4
5
6
7
8
9
10
11
12
13
14
15
16
17
18
19
20
21
22
23
24
25
26
27
28
29
30
31
32
33
34
35
36
37
38
39
40
41
42
43
44
45
46
47
48
49
50
51
52
53
# use Tkinter to show a digital clock
# tested with Python24    vegaseat    10sep2006
# https://www.daniweb.com/software-development/python/code/216785/tkinter-digital-clock-python
# http://en.sharejs.com/python/19617
 
# AW2015-04-24
# added: UTC, localtime, date, MJD, DOY, week 
from Tkinter import *
import time
import jdutil # https://gist.github.com/jiffyclub/1294443
 
root = Tk()
root.attributes("-fullscreen", True) 
# this should make Esc exit fullscrreen, but doesn't seem to work..
#root.bind('',root.attributes("-fullscreen", False))
root.configure(background='black')
 
#root.geometry("1280x1024") # set explicitly window size
time1 = ''
clock_lt = Label(root, font=('arial', 230, 'bold'), fg='red',bg='black')
clock_lt.pack()
 
date_iso = Label(root, font=('arial', 75, 'bold'), fg='red',bg='black')
date_iso.pack()
 
date_etc = Label(root, font=('arial', 40, 'bold'), fg='red',bg='black')
date_etc.pack()
 
clock_utc = Label(root, font=('arial', 230, 'bold'),fg='red', bg='black')
clock_utc.pack()
 
def tick():
    global time1
    time2 = time.strftime('%H:%M:%S') # local
    time_utc = time.strftime('%H:%M:%S', time.gmtime()) # utc
    # MJD
    date_iso_txt = time.strftime('%Y-%m-%d') + "    %.5f" % jdutil.mjd_now()
    # day, DOY, week
    date_etc_txt = "%s   DOY: %s  Week: %s" % (time.strftime('%A'), time.strftime('%j'), time.strftime('%W'))
 
    if time2 != time1: # if time string has changed, update it
        time1 = time2
        clock_lt.config(text=time2)
        clock_utc.config(text=time_utc)
        date_iso.config(text=date_iso_txt)
        date_etc.config(text=date_etc_txt)
    # calls itself every 200 milliseconds
    # to update the time display as needed
    # could use >200 ms, but display gets jerky
    clock_lt.after(20, tick)
 
tick()
root.mainloop()

This uses two small additions to jdutil:

1
2
3
4
5
6
7
def mjd_now():
    t = dt.datetime.utcnow()
    return dt_to_mjd(t)
 
def dt_to_mjd(dt):
    jd = datetime_to_jd(dt)
    return jd_to_mjd(jd)

Keysight 53230A noise floor test

We got a new 53230A counter to the lab, so I decided to run some basic tests on it.

I collected time interval data using a 1-PPS source (H-maser through a SRS DG645), and wired this with a T-connector from CH1 to CH2 with a ~1 m (10 ns delay) cable. This should show the noise floor for time interval measurements as well as CH1/CH2 timing skew when measured the other way around (i.e. from CH2 to CH1). The 10 MHz external reference (at the back) was connected to a H-maser.

53230A_PPS_skew
The results show standard deviations of 12 ps (CH1->CH2) and 11 ps (CH2->CH1) respecively, with a channel skew of 112 ps. Compare to the single-shot spec of sqrt(2)*20 ps = 28 ps and Agilent/Keysight's marketing video on youtube.

I also collected 10 MHz frequency counter readings on CH1 (source: H-maser) with gate times of 0.1 s, 1.0 s, and 10.0 s. I collected the data with a simple program that just calls the "READ?" function repeatedly, which does result in some dead-time between measurements.

Here are the results in terms of Allan deviation. I used allantools.

Keysight_53230A_noise_floor

The time interval noise floor looks like white phase noise with an Allan deviation of 1.8e-11/tau. This is consistent with the 12 ps RMS value found above. It is left as an exercise for the reader to show that ADEV(1s) = sqrt(3)*RMS-time-interval-noise (correct??).

The frequency counting noise floor depends on the gate time, and I get 5e-12/sqrt(tau), 2e-12/sqrt(tau), and 6e-13/sqrt(tau) for gate times of 0.1 s, 1.0 s, and 10.0 s, respectively. This looks like white frequency noise. Enrico Rubiola has notes on frequency counters that may explain the numbers.

White Rabbit Switch PPS-output test

We got some White Rabbit Switches and I did an initial test of the pulse-per-second (PPS) output stability. In contrast to earlier measurements that showed 200ps or so of white phase noise, the PPS output on the WRS now seems a lot more stable. For various reasons the noise-floor (red data) of our 53230A time-interval-counter is at around 50e-12 @ 1s, and the WRS PPS output is at very much the same level of stability. Another 53230A counter shows about 13 ps standard-deviation for a cable-delay measurement - so I may redo these measurements with that counter. In any case a real evaluation of the short-term stability requires a DMTD measurement at 10 MHz.

53230A counter input channel fix

Update: after the fix the counter seems OK again. 12 ps standard deviation (61k PPS-pulses, collected over 17 hours) on a cable-delay test:
54230A_cable-delay

53230A_fix

A broken CH1 input trace seems to be a common problem on the Agilent/Keysight 53230A counter. This is the second unit with the same problem we have seen.

The fix is to bypass the broken trace with a wire directly from the center of the input-BNC to the next unpopulated SMD-pad.

Clock Laser beat-note

Here's the beat-note, as seen on a spectrum analyzer, between a red laser at 445 THz (or 674 nm, if you prefer wavelengths instead of frequencies) and a femtosecond frequency comb. The frequency comb has evenly spaced (100 MHz in our case) 'teeth' at well-defined multiples of RF-frequencies that we can lock to a H-maser. This allows absolute frequency measurements of the optical frequency at 445 THz. Currently we are trying to improve the SNR of the beat-note so that a frequency-counter will give a stable output reading of the beat-note frequency. The video shows about 20 dB of SNR using 10 kHz RBW (if you are optmistic), but reliable counting requires around 25 dB SNR using a 100 kHz RBW.

This laser will be used as the 'clock-laser' in our  ion-clock where it is used to drive a narrow clock-transition of a single laser cooled Sr+ ion. Earlier I blogged about measuring the thermal expansion of the optical cavity that is used to stabilize the laser.

Pulse Stretcher - V2

Update: kicad files: 2014-07-23-pulse_stretcher_kicad

A development on pulse stretcher V1.

This circuit is used to stretch a short 10 ns pulse from a photon-counting module to a 100ns long pulse that can be more easily recorded or time-stamped e.g. with the white rabbit fine-delay FMC.

pulse_stretch_schematic_2014-06-30

The new circuit is the same LT1711-based design as the old one, with an added buffer (BUF602) on the output. This improves output-load handling because the BUF602 can drive both 50 Ohm and 1 MOhm loads.

The PCB is made to fit a BNC-BNC enclosure by Pomona.

pulse_stretch_2014-06-30

pulse_stretcher_assembled

Some testing with an artificial input-pulse from a Keithley 3390 signal-generator..

pulse_stretcher_test_keithley3390

.. and with the actual PMT-pulse. Note how the 100MHz scope produces nice round smooth signals while the 500 MHz Tektronix reveals more of the ugly truth.

pulse_stretcher_test_PMT

ADF4350 PLL+VCO and AD9912 DDS power spectra

Update 2015-09-28: ADEV and Phase-noise measured with a 3120A:


Here's the 1 GHz output of an ADF4350 PLL+VCO evaluation board, when used with a 25 MHz reference.

The datasheet shows a phase noise of around -100 dBc/Hz @ 1-100 kHz, so this measurement may in fact be dominated by the Rigol DSA1030A phase noise which is quoted as -88 dBc/Hz @ 10 kHz.

1GHz_adf4350_output_with_25MHz_ref-input

The 1 GHz output from the ADF4350 is used as a SYCLK input for an AD9912 DDS. The spectrum below shows a 100 MHz output signal from the DDS with either a 660 MHz or 1 GHz SYSCLK. The 660 MHz SYSCLK is from a 10 MHz reference multiplied 66x by the AD9912 on-board PLL. The 1 GHz SYSCLK is from the ADF4350, with the AD9912 PLL disabled.

The AD9912 output is clearly improved when using an external 1 GHz SYSCLK. The noise-floor drops from -80 dBm to below -90 dBm @ 250 kHz from the carrier. The spurious peaks at +/- 50 kHz disappear. However this result is still far from the datasheet result where all noise is below -95 dBm just a few kHz from the carrier. It shouldn't matter much that the datasheet shows a 200MHz output while I measured a 100 MHz output.

Again I suspect the Rigol DSA1030A's phase-noise performance of -88dBc/Hz @ 10 kHz may in fact significantly determine the shape of the peak. Maybe the real DDS output is a clean delta-peak, we just see it like this with the spectrum analyzer?

100MHz_AD9912_internal_vs_external_PLL

Martein/PA3AKE has similar but much nicer results over here: 1 GHz refclock and 14 MHz output from AD9910 DDS. Amazingly both these spectra show a noise-floor below -90 dBm @ 50 Hz! Maybe it's because the spectrum analyzer used (Wandel & Goltermann SNA-62) is much better?

Photon-correlation test with modulated LED

Further testing of the time-stamping hardware. The idea was to generate a weak beam of light with an intensity modulation at 1-12 MHz, count and time-stamp the photons, and see if the modulation can be measured with a correlation histogram.

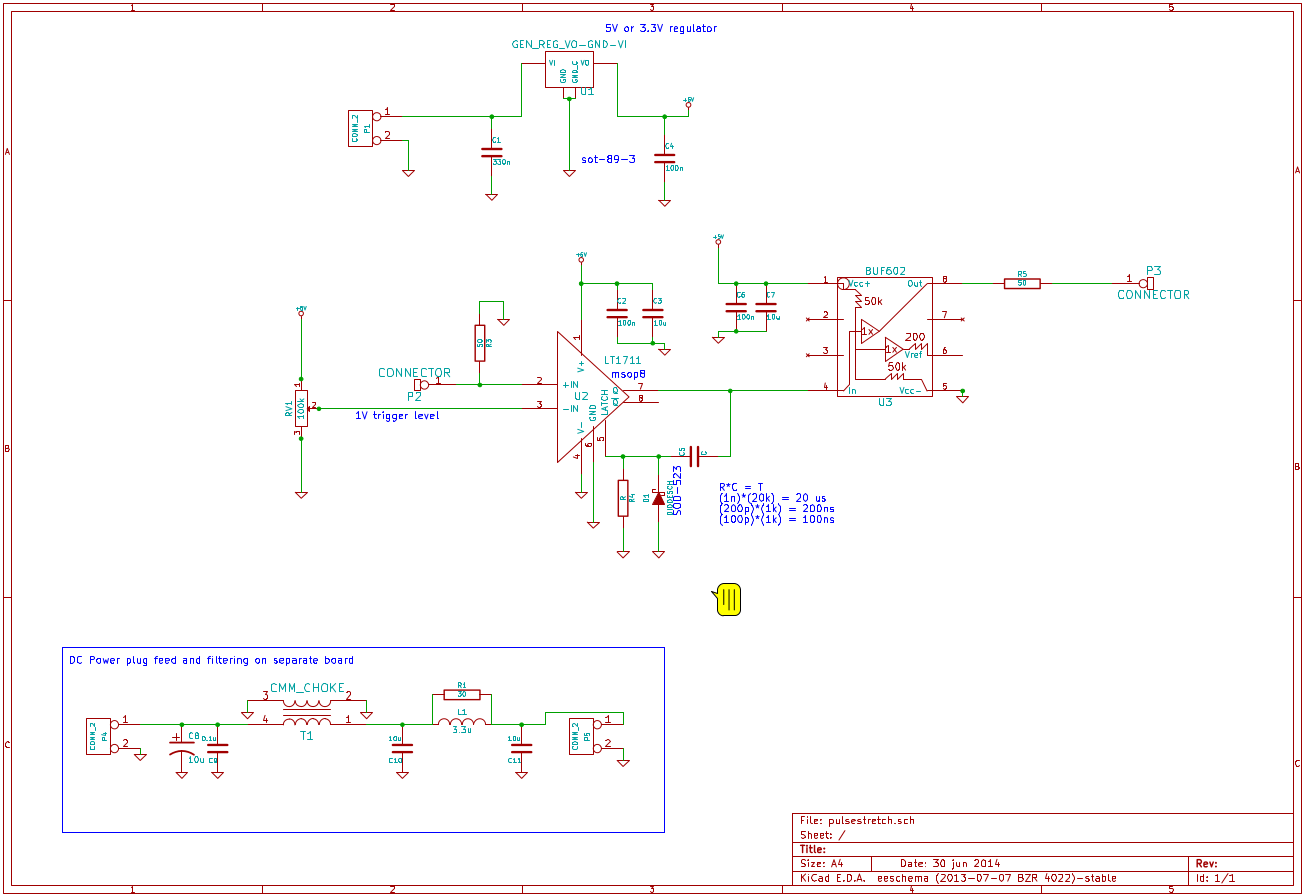
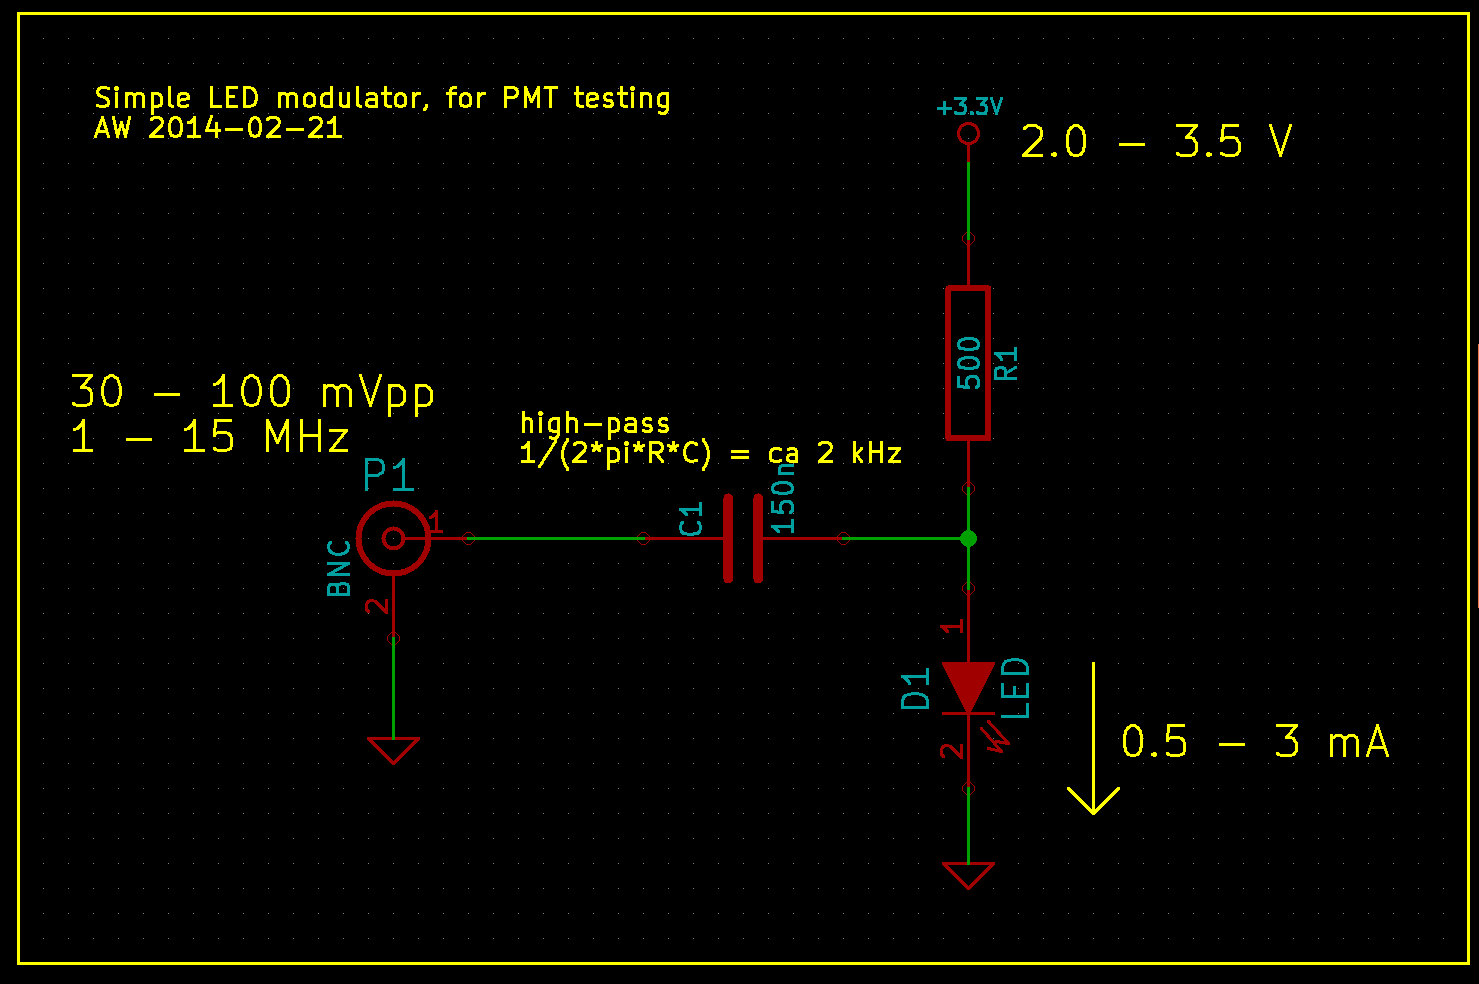
To generate a stream of photons intensity modulated at a frequency f_mod I used this simple LED circuit driven by an adjustable DC power-supply and a signal generator. I didn't test the bandwidth of the circuit and LED, but it seems to work well for this test at least up to 12 MHz.

led_modulator_2014-02-21

If we are given such a stream of photons, with an average rate of say 10 kphotons/s, how do we detect that the modulation at MHz frequencies is there? Note that the average rate of photons is much much smaller than the modulation frequency. If we receive photons at 10 kcounts/s there is on average 1000 cycles of modulation between each photon-event, when f_mod=10 MHz.

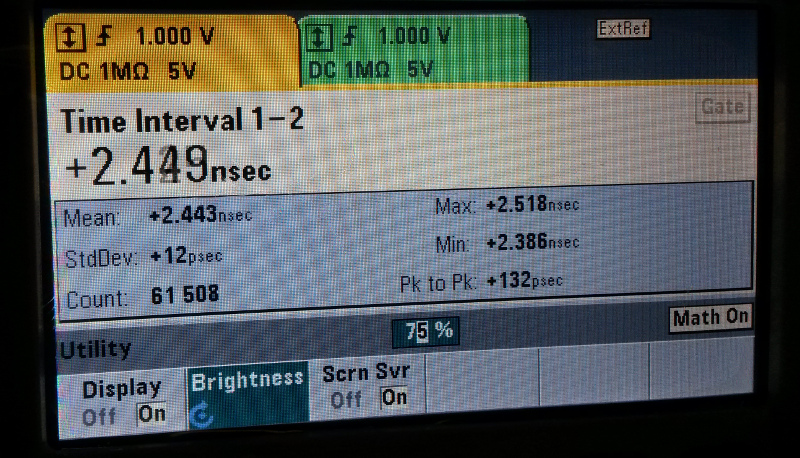
One way is to count the photons with a photon-counter, and time-stamp each photon. We should now on average see more/less photons every 1/f_mod seconds. So if we histogram all time stamps modulo 1/f_mod, we should get a sine-shaped histogram. This assumes that the signal generator creating f_mod and our time-stamping hardware share a common time-base.

This works quite nicely!

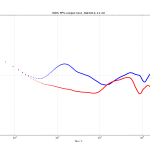
At the start of the video we see only the dark counts of the PMT. A DC voltage is then applied to the LED and the histogram rises up, but remains flat. When the modulation is applied we immediately see a sine-shape of the histogram. If we adjust the the frequency, phase, or amplitude of the modulation we see a corresponding change in the histogram.

The video first has testing at f_mod=1 MHz, with a histogram modulo 1/f_mod = 1000 ns, and later with f_mod=12 MHz and the histogram modulo 83333 ps. The later part of the video also has a least-squares sin() fit to the data.

This technique is very sensitive to mismatch between the applied frequency f_mod, and the histogram mod-time 1/f_mod. I first wanted to try this at 12 MHz, so I set the histogram mod-time to 83333 ps - and saw no sine-histogram at all! This was because I had rounded 1/f_mod to the nearest picosecond, and 1/83333 ps is actually 12 000 048 Hz - not 12 MHz!
At 12 MHz a deviation of 48 Hz is a few ppm in fractional frequency, and I later tested that changing f_mod by a fraction of ca 1e-8 makes the histogram slowly wander to the left or right. Any larger deviation and the correlation is lost.
All of this is similar to a lock-in technique, so the same principles should apply.