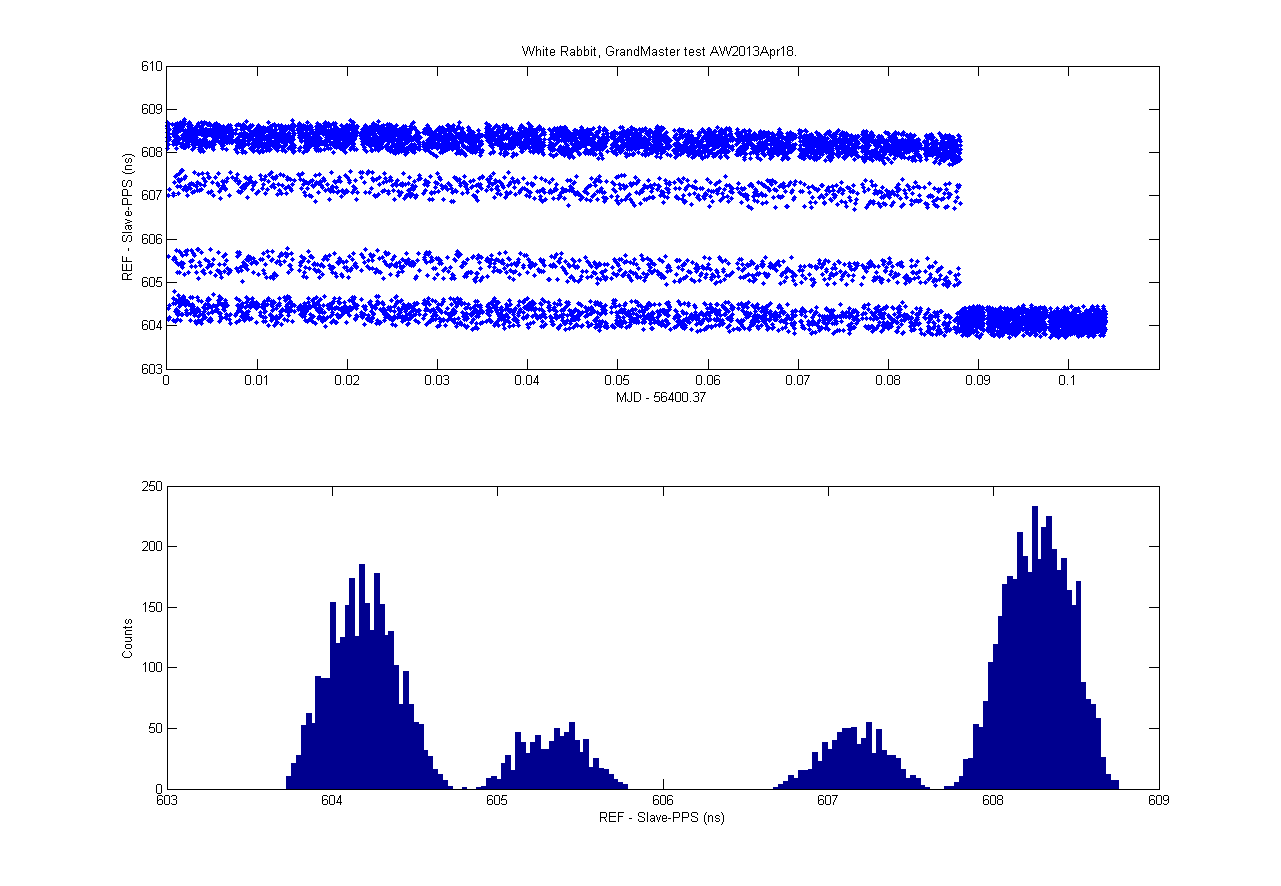
Update3: Here's what happens if you disconnect the master from the switch. The slave clock runs off on its own, with about 5ppm drift compared to the reference clock. Once the fiber is connected again it takes a few seconds to re-sync and lock on to the master clock.
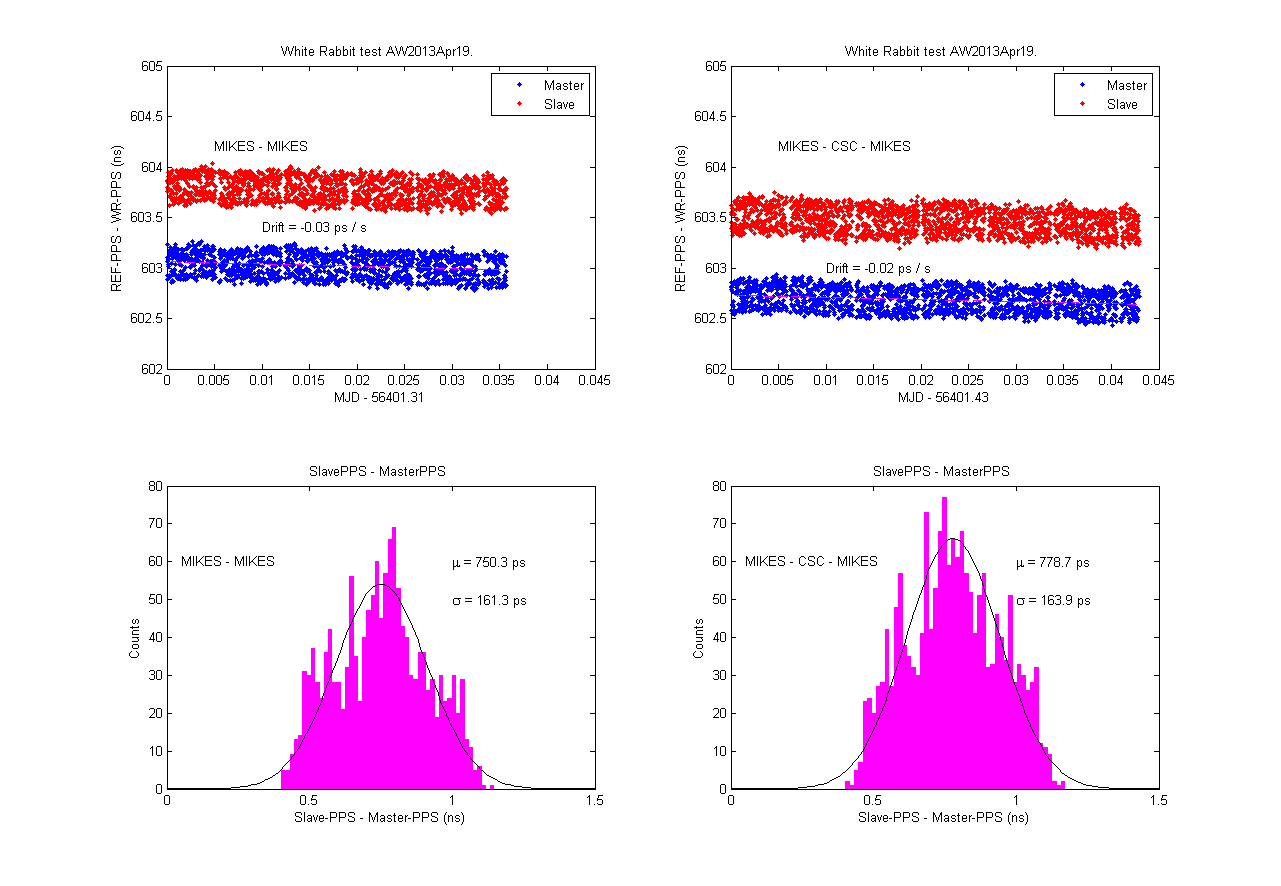
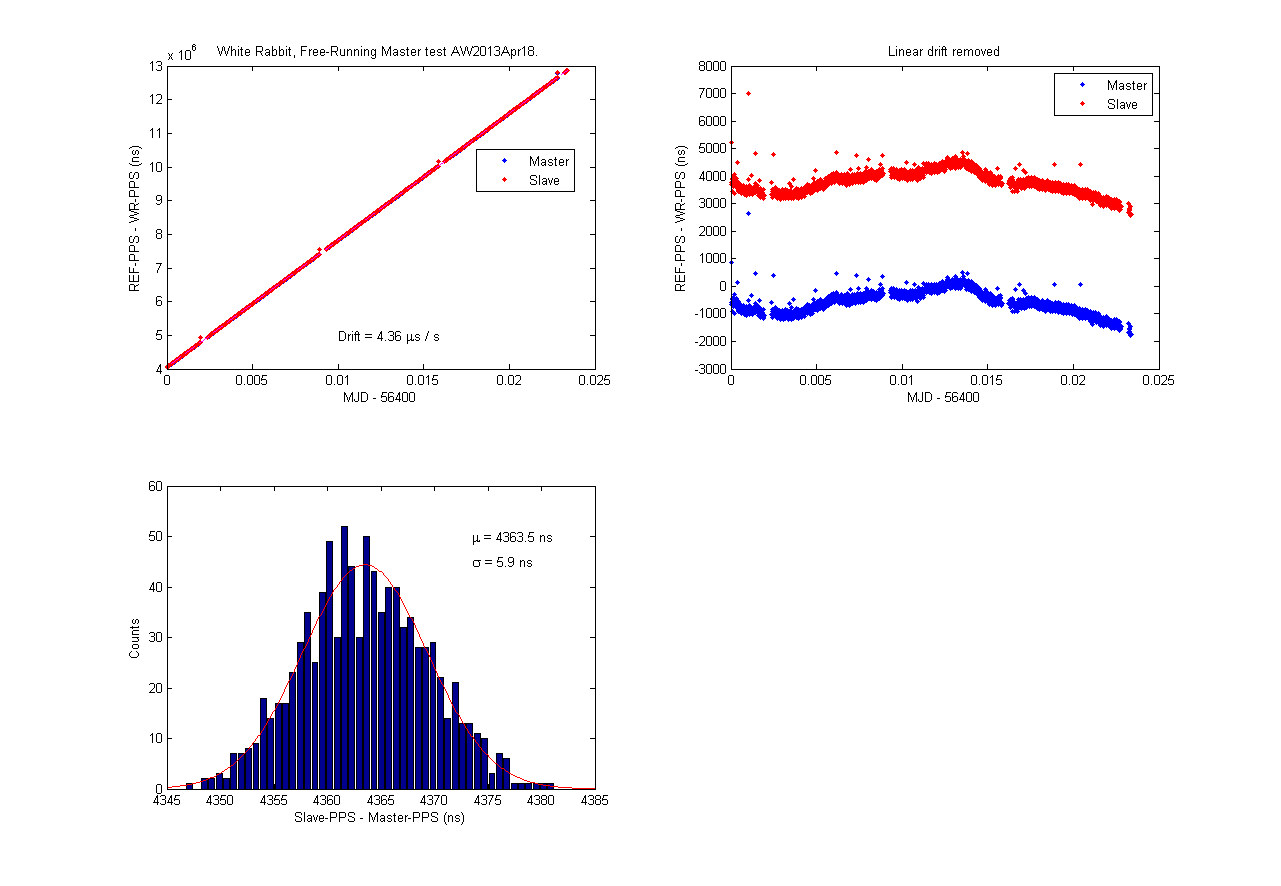
Update2: two different measurements, on the left with a short 2m fiber, and on the right with a few hundred meters of fiber to a WR-Switch, and a few hundred meters back.
Update: an improved measurement now shows some promise:
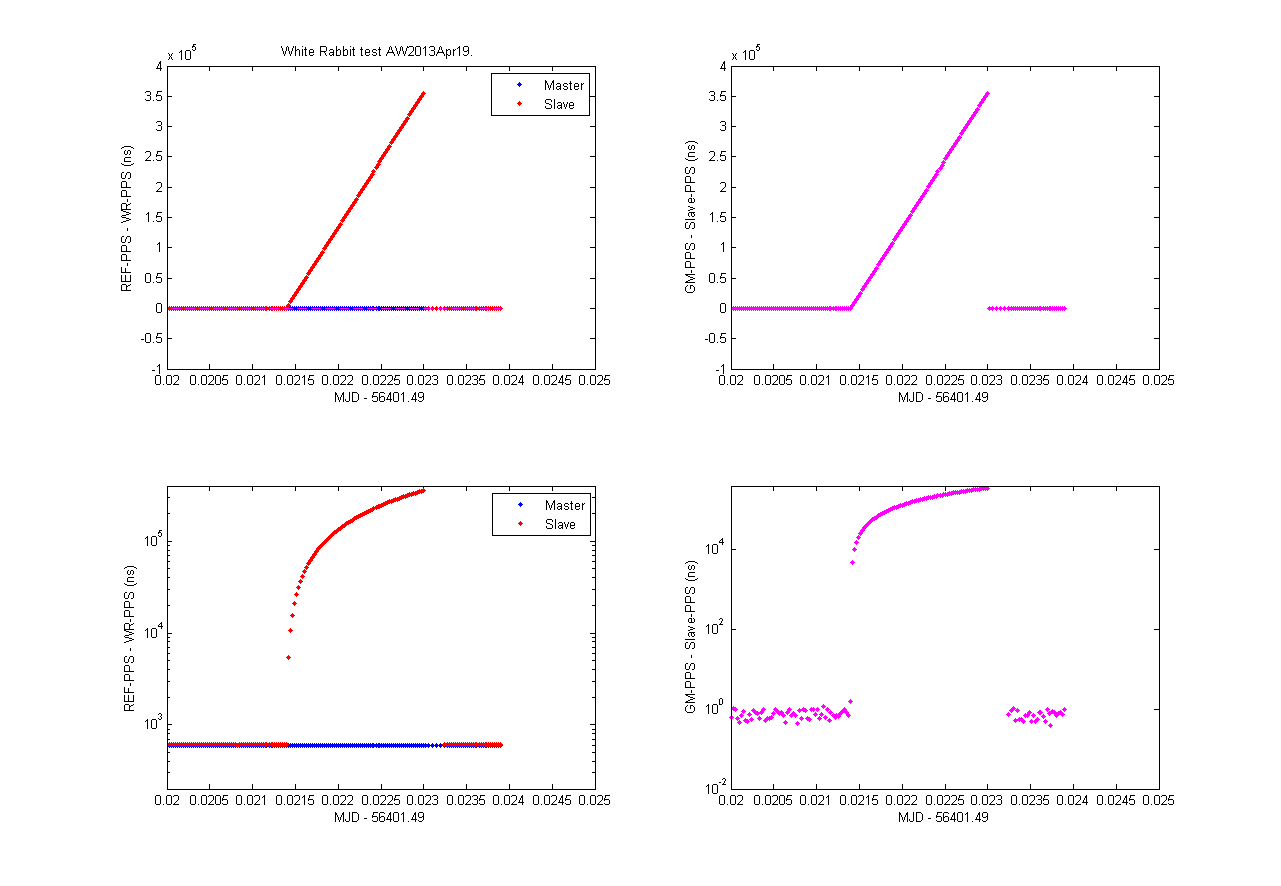
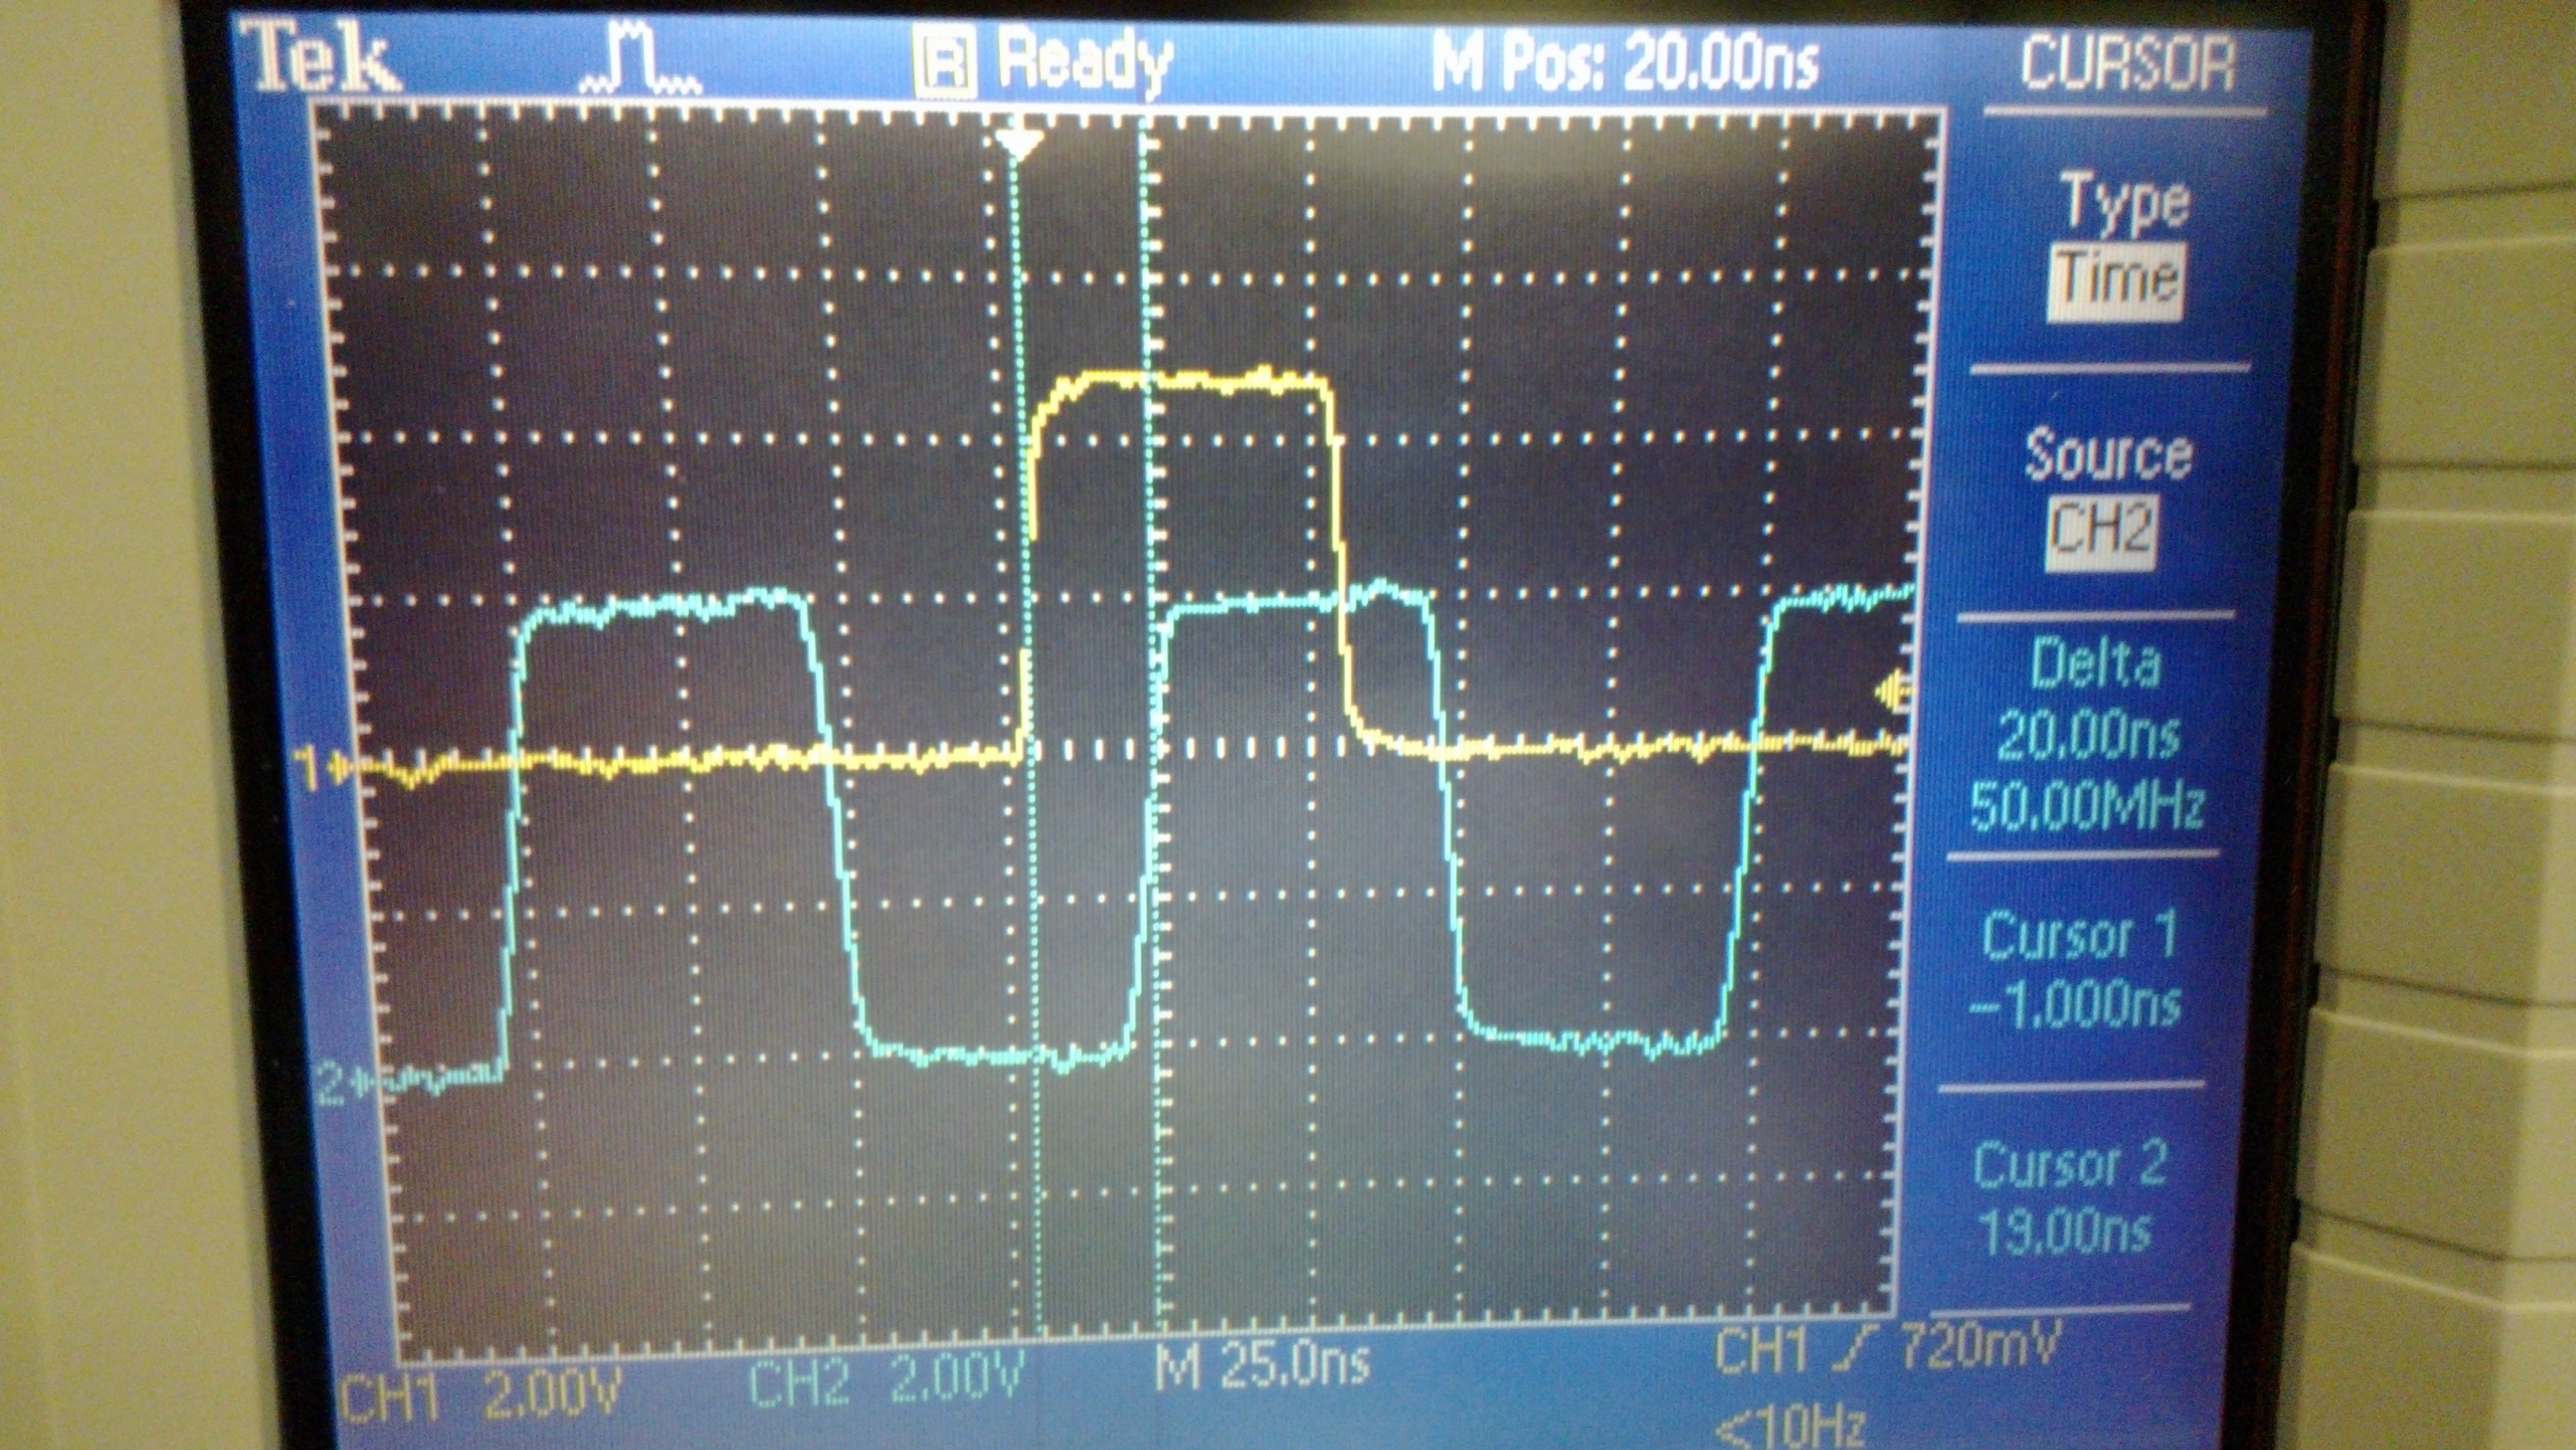
Testing White Rabbit at work. These are fancy network-cards connected by optical fiber which allow synchronization between the cards at better than 1 nanosecond level. My first results are a bit strange:
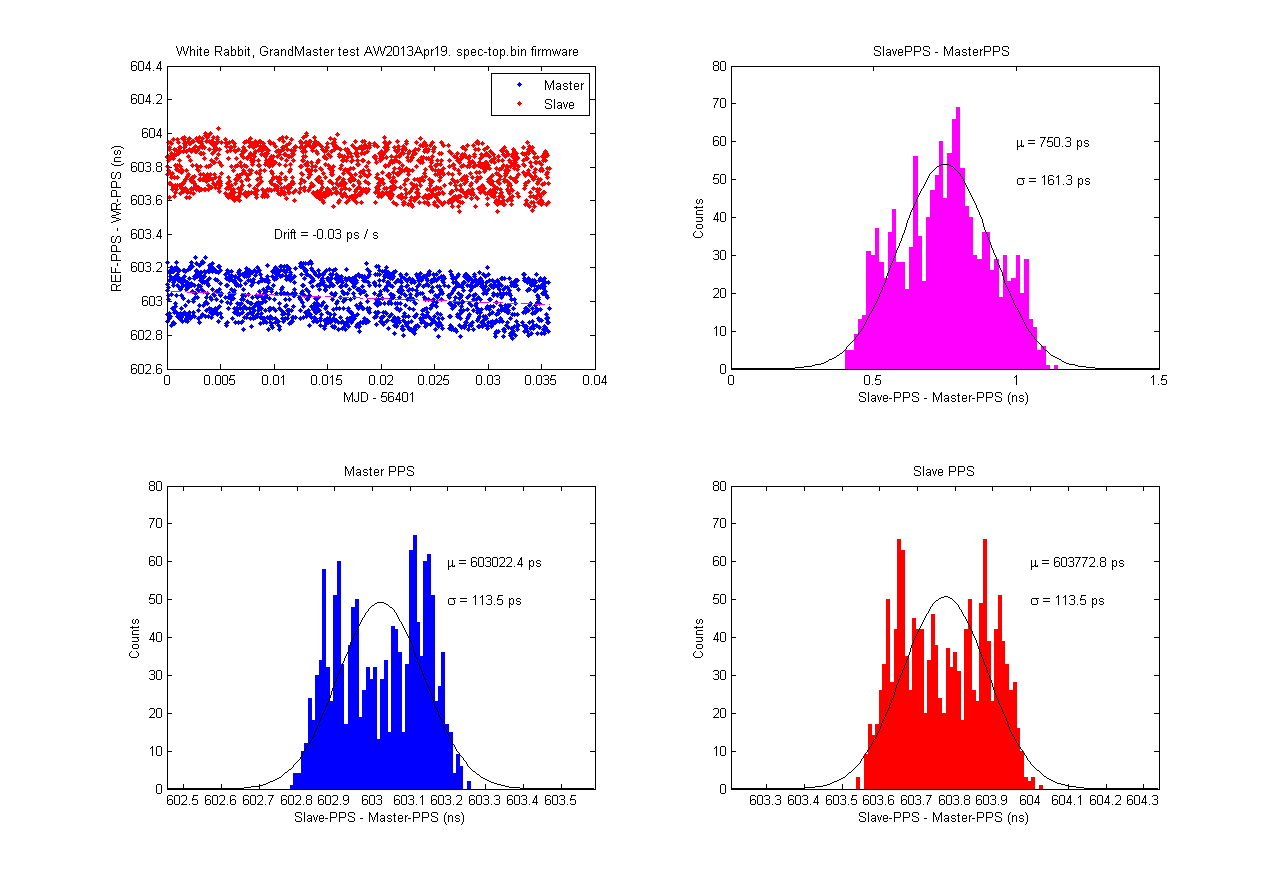
This is in "grandmaster" mode where we input a 1 PPS and a 10 MHz signal to one of the cards:
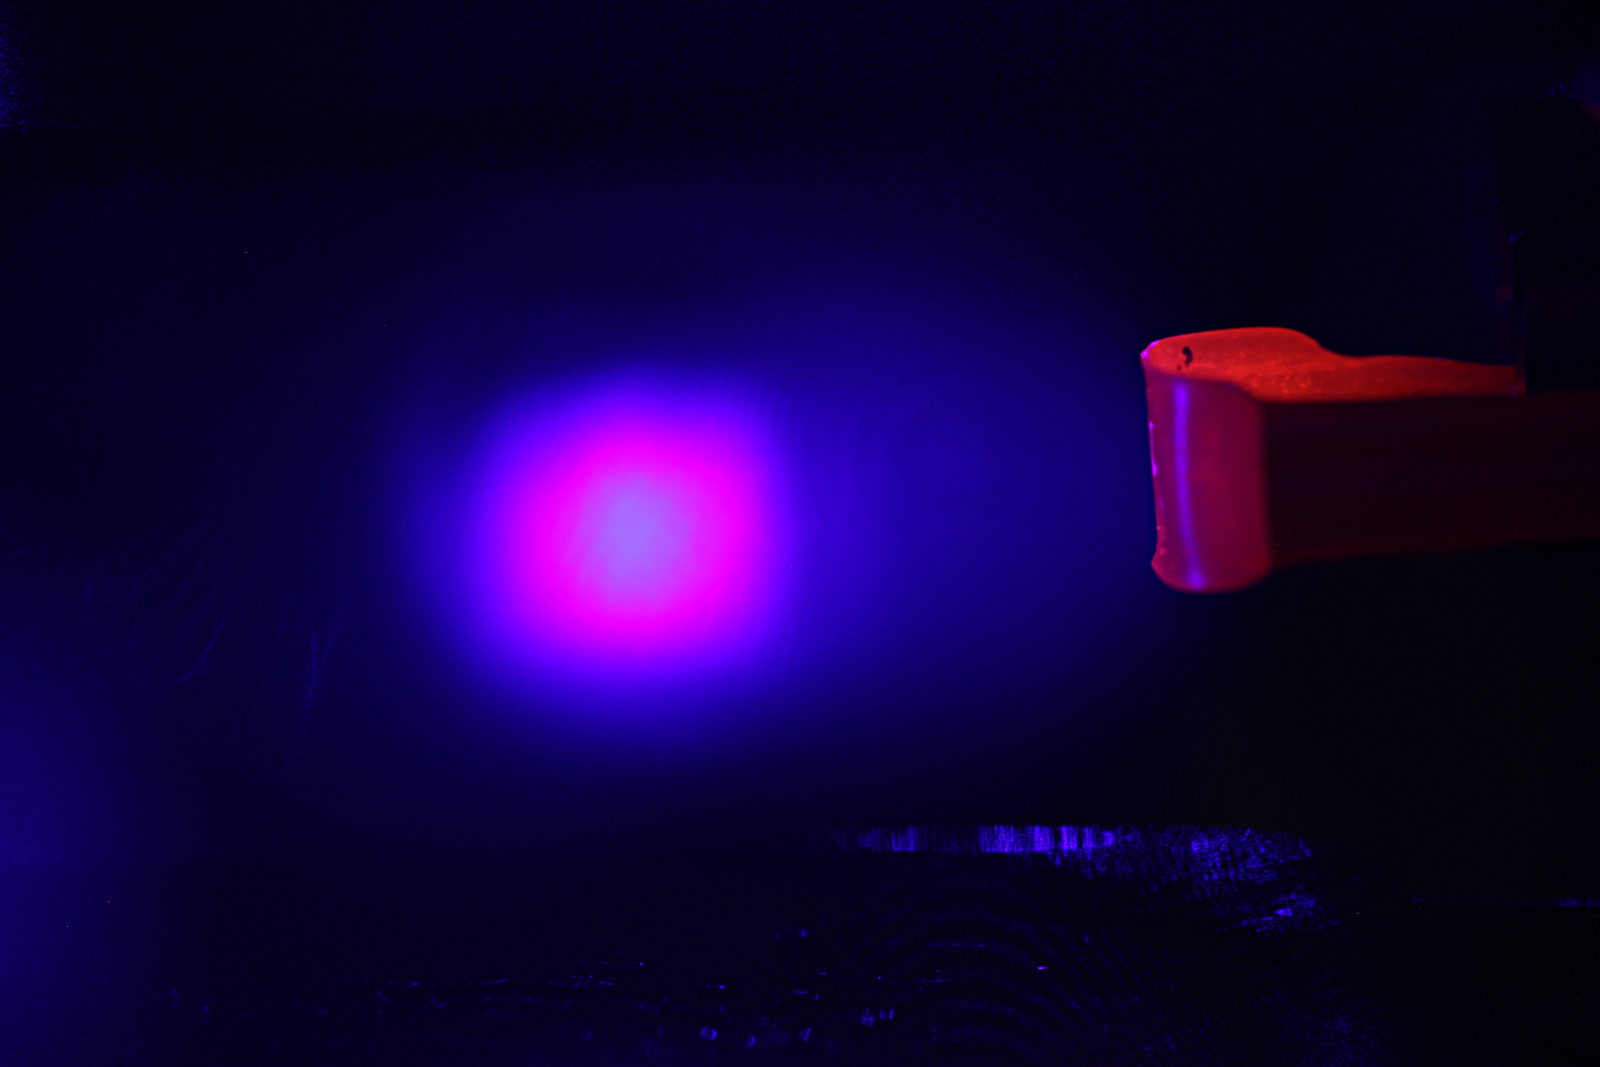
We've been playing with a blue laser at 461 nm in the lab lately. If tuned to just the right frequency (wavelength) neutral Strontium atoms will strongly absorb the laser light. Shortly (5 nanoseconds) after that the atoms emit at 461nm also, allowing us to see them:
The atoms originate from a hot "oven" at the right. It glows dark red because it's heated by driving a 5 A to 7 A current through it. The cloud of absorbing atoms glows at 461nm in the centre of the picture.
We can scan the laser frequency by adjusting the current through the diode-laser that produces the light. If the frequency is too low or too high we'll see nothing as the light will just pass through the cloud of atoms without interacting. On each side of the correct absorption frequency we'll see different parts of the atom cloud light up. This happens because the atoms stream out of the oven in slightly different directions, so they experience a different Doppler shift and will react to light with a wavelength slightly to the blue or red from the centre of the absorption-line at 461nm.
When slowly scanning the laser frequency over the absorption-line we got these nice videos. One with a narrow beam and one where the laser beam was expanded.
These were shot with a Canon DSLR so be sure to view them in HD on youtube!
(Time-lapse of ca 18 hour experiment. Bottom left is a spectrum-analyzer view of the beat-note signal. Top left is a frequency counter reading of the beat-note. Bottom right is a screen showing the a camera-view of the output-beam from the resonator)
This is a measurement of the thermal expansion of a fancy optical resonator made from Corning "Ultra Low Expansion" (ULE) glass. This material has a specified thermal expansion of 0.03 ppm/K around room temperature. This thermal expansion is roughly 800-times smaller than Aluminium, around 400-times smaller than Steel, and 40-times better than Invar - a steel grade specifically designed for low thermal expansion.
Can we do even better? Yes! Because ULE glass has a coefficient of thermal expansion (CTE) that crosses zero. Below a certain temperature it shrinks when heated, and above the zero-crossing temperature it expands when heated (like most materials do). This kind of behavior sounds exotic, but is found is something as common as water! (water is heaviest at around 4 C). If we can use the ULE resonator at or very close to this magic zero-crossing temperature it will be very very insensitive to small temperature fluctuations.
So in the experiment I am changing the temperature of the ULE glass and looking for the temperature where the CTE crosses zero (let's call this temperature T_ZCTE). The effect is fairly small: if we are 1 degree C off from T_ZCTE we would expect the 300 mm long piece of ULE glass to be 200 pm (picometers) longer than at T_ZCTE. That's about the size of a single water-molecule, so this length change isn't exactly something you can go and measure with your digital calipers!
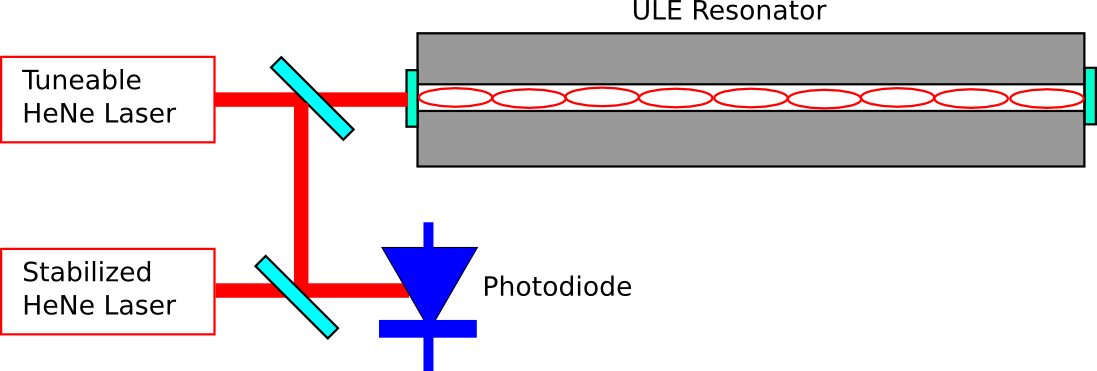
Here's how it's done (this drawing is simplified, but shows the essential parts of the experiment):
We take a tuneable HeNe laser and lock the frequency of the laser to the ULE-cavity. The optical cavity/resonator is formed between mirrors that are bonded to the ends of the piece of ULE glass. We can lock the laser to one of the modes of the cavity, corresponding to a situation where (twice) the length of the cavity is an integer number of wavelenghts. Now as we change the temperature of the ULE-glass the laser will stay locked, and as the glass shrinks/expands the wavelength (or frequency/color) of the laser will change slightly.
Directly measuring the frequency of laser light isn't possible. Instead we take second HeNe laser, which is stabilized to have a fixed frequency, and detect a beat-note between the stabilized laser and the tuneable laser. The beat-note will have a frequency corresponding to the (absolute value of the) difference in frequency between the two lasers. Now measuring a length-change corresponding to the size of a single water-molecule (200 pm) shouldn't be that hard anymore!
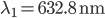
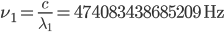
Let's say the stabilized laser has a wavelength of (red light). Its frequency will be (that's around 474 THz). When the tuneable laser is locked to the cavity we force its wavelength to agree with where is an integer and is the length of the cavity. I've drawn only a small number of wavelengths in the figure, but a realistic integer is . We get and , very nearly but not quite the same wavelength/frequency as the stabilized laser. Now our photodiode which measures the beat-note will measure a frequency of .
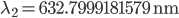
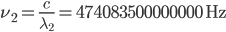
How does this change when the ULE glass expands by 200 pm? When we heat or cool the cavity by 1 degree C the length changes to 300 mm + 200 pm, and the wavelength of the tuneable laser will change to . Now our beat-note detector will show . That's a change in the beat-note of more than 300 kHz - easily measurable!
That's how you measure a length-change corresponding to the diameter of a water molecule!
Why do this? Some of the best ultra-stable lasers known are made by locking the laser to this kind of ULE-resonator. Narrow linewidth ultra-stable lasers are interesting for a host of atomic physics and other fundamental physics experiments.
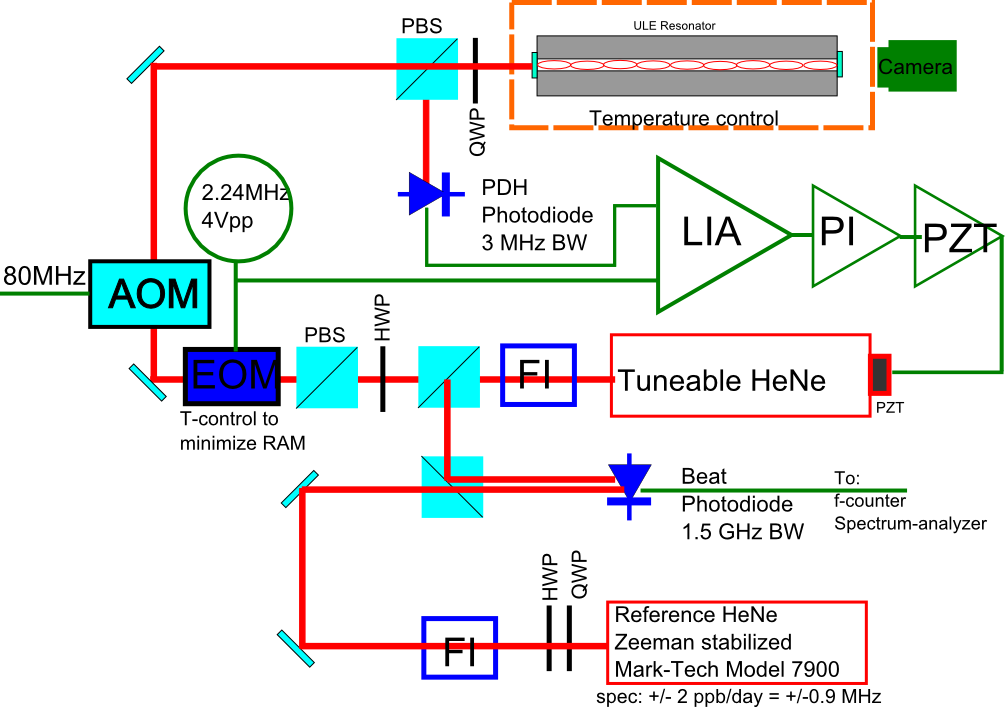
Update 2013 August: I made a drawing in inkscape of the experimental setup.
This figure shows most (if not all?) of the important components of this experiment. The AOM is not strictly required but I found it useful to shift the tuneable HeNe laser by +80 MHz to reach a TEM-00 mode of the ULE resonator. Not shown is a resonance-circuit (LC-tank) between the 2.24MHz sinewave-generator and the EOM. The EOM was temperature controlled by a TEC with an NTC thermistor giving temperature feedback.
I've been measuring the beat-note (wikipedia talks about sound-waves, but it works for light-waves too) between two HeNe lasers. It jumps around maybe +/- 5 MHz quite rapidly which is not nice at all:
One laser is a commercial stabilized laser (I've tried both a HP5501A and a Mark-Tech 7900), and the other laser is a tunable one which I want to use for my experiment. But with this much jumping around the tunable laser is no good for the experiment I want to do 🙁