Dual-needle pyVCP meter

dual_meter

By popular demand, a quick hack that modifies the pyVCP meter widget to have two independent needles. It's used inside the <meter> tag by specifying <halpin2>"my2ndpin"</halpin2> and hooking up something to that pin. If <halpin2> is not used meter works as before, showing only one needle.

There's an XML file for this test-panel, a short HAL-file that hooks up the pins, and a shell script to run it all here: pyvcp_dual-needle-test

The modifications to linuxcnc source required are in lib/python/pyvcp_widgets.py: 0002-dual-needle-meter-use-with-halpin2-meter2-halpin2.patch
NOTE: This is a quick hack to make it work - don't take my code/patch too seriously...

Real-Time Tuning

I tried a number of things that are supposed to improve real-time performance, as described in this forum post.

But not much changed. This series of jitter-histograms shows little or no changes:

0 1 2 3 4

The things I tried are roughly

  1. measure first latency histogram 0.png
  2. uninstall the package irqbalance using synaptic. reboot.
  3. measure 1.png
  4. in /etc/default/grub modify GRUB_CMDLINE_LINUX_DEFAULT="isolcpus=1 acpi_irq_nobalance noirqbalance"  (Aside: why are the files in /etc/grub.d/ made so incredibly hard to read? Someone should re-write them in Python!). Run sudo update-grub. reboot.
  5. measure 2.png
  6. Add irq-affinity.conf to /etc/init/
  7. Add set-irq-affinity and watchirqs to /usr/local/sbin. reboot
  8. measure 3.png
  9. Try to tweak BIOS settings. Turn off power-saving features, etc.
  10. measure 4.png

The output of watchirqs looks like this:

watchirqs_before_boot watchirqs_last

The scripts mentioned above: irqstuff

Temperature PID control - Part Deux

Update: this version of the component may compile on 10.04LTS without errors/warnings: frequency2temperature.comp (thanks to jepler!)

There's been some interest in my 2-wire temperature PID control from 2010. It uses one parallel port pin for a PWM-heater, and another connected to a 555-timer for temperature measurement. I didn't document the circuits very well, but they should be simple to reproduce for someone with an electronics background.

Here's the HAL setup once again:

The idea is to count the 555 output-frequency with an encoder, compare this to a set-point value from the user, and use a pid component to drive a pwm-generator that drives the heater.

Now it might be nicer to set the temperature in degrees C instead of a frequency. I've hacked together a new component called frequency2temperature that can be inserted after the encoder. This obviously required the thermistor B-parameters as well as the 555-astable circuit component values as input (these are hard-coded constants in frequency2temperature.comp) . Like this:

I didn't have the actual circuits and extruder at hand when coding this. So instead I made a simulated extruder (sim_extruder) component and generated simulated 555-output. Like this:

This also requires a conversion in the reverse direction called temperature2frequency. A stepgen is then used to generate a pulse-train (simulating the 555-output).

  • The INI and HAL files for the simulated extruder, based on the default axis_mm config: simextruder
  • frequency2temperature component:  frequency2temperature.comp (install with: "comp --install frequency2temperature.comp")
  • temperature2frequency component: temperature2frequency.comp (only for simulated setup, not required if you have actual hardware)
  • sim_extruder component: sim_extruder.comp (only for simulated setup, not required if you have actual hardware)

"heartyGFX" has made some progress on this. He has a proper circuit diagram for the PWM-heater and 555-astable. His circuits look much nicer than mine!

The diagrams above were drawn with Inkscape in SVG format: temp_pid_control_svg_diagrams

Why Real-Time?

Why bother with these real-time kernels and APIs at all? Isn't timing on a modern PC good enough? Look at this:

This histogram shows latency-numbers from the same 1ms thread test run compiled without (red) and with (green) real-time enabled. All the green real-time data clusters around zero +/- 20us. Without real-time enabled the event we are expecting to happen every 1 ms might happen almost 1 ms too early, or up to 3 ms late. With real-time the timing is mostly consistent to better than 1% (10 us) with a worst-case jitter of 2% (20 us).

Latency Histogram

This shows a latency-histogram for a 1 ms thread running on Xenomai on my recently acquired ITX-board. Note how badly the histogram is approximated by a normal distribution (Gaussians look like parabolas with logarithmic y-scale!). See also Michael's recent RPi data and  Kent's Athlon/P4 data.

The usual latency-test numbers people report is the maximum latency, a measure of how far out to the left or right the most distant single data point lies. The histrogram can probably be used to extract many more numbers, but for real-time critical applications like cnc-machine control the maximum latency is probably an OK figure of merit.

The latency numbers are recorded with a simple HAL component:lhisto.comp

The instantaneous latency-number is then put in a FIFO by the real-time component sampler and written to a text-file using halsampler. I'm setting this up with the following HAL commands (put this in a file myfile.halrun and run with "halrun -f myfile.halrun")

loadrt threads name1=servo period1=1000000
loadrt sampler depth=1000 cfg=S
loadrt lhisto names=shisto
addf shisto servo
addf sampler.0 servo
net latency shisto.latency sampler.0.pin.0
start
loadusr halsampler -c 0  latencysamples.txt

The numbers can now be plotted with matplotlib. I'm using the following script:

1
2
3
4
5
6
7
8
9
10
11
12
13
14
15
16
17
18
19
20
21
22
23
24
import numpy as np
import matplotlib.pyplot as plt
import matplotlib.mlab as mlab
# load data from file
x = np.loadtxt('latencysamples.txt' )
x=x/1e3 # convert to microseconds
 
fig = plt.figure()
ax = fig.add_subplot(111)
nbins = len(x)/1000
n, bins, patches = ax.hist(x, nbins,  facecolor='green', alpha=0.5, log=True)
bincenters = 0.5*(bins[1:]+bins[:-1]) # from matlplotlib example code
mu = np.mean(x)
sigma = np.std(x)
area = np.trapz(n,bincenters) # scale normpdf to have the same area as the dataset
y = area * mlab.normpdf( bincenters, mu, sigma)
l =  ax.plot(bincenters, y, 'r--', linewidth=1)# add a 'best fit' line for the normal PDF
 
ax.set_xlabel('Latency ( $ \mathrm{ \mu s } $ ) ')
ax.set_ylabel('Counts')
ax.set_title('Latency Histogram\n 12.04LTS + 3.2.21-xenomai+')
ax.set_ylim(1e-1, 10*max(n))
ax.grid(True)
plt.show()

LinuxCNC on Ubuntu 12.04LTS

Recent developments has made it possible to run LinuxCNC on the latest LTS release of Ubuntu. This is experimental work, so not recommended for controlling a real machine just yet. The main obstacle for moving LinuxCNC from 10.04LTS to a more recent distribution has been the RTAI real-time kernel, which has not been kept up-to-date with development of the normal Linux kernel. Fortunately there are alternatives such as Xenomai or RT_PREEMPT.

Here is a step-by-step description of the install/build process, if you want to experiment with this.

  1. Download and install a normal 32-bit 12.04LTS Ubuntu (ubuntu-12.04.1-desktop-i386.iso). Note that the 64-bit version is not supported for the steps that follow further down. I could not get Ubuntu's startup-disk-creator to work, so I used unetbootin to write the ISO-file to a USB-stick.
  2. It's possible to compile the xenomai-kernel from scratch, along with the runtime etc., but I used pre-compiled deb-packages by Michael Haberler from here: http://static.mah.priv.at/public/xenomai-debs/
  3. Install the xenomai kernel:
    sudo dpkg -i linux-headers-3.2.21-xenomai+_0.1_i386.deb
    sudo dpkg -i linux-image-3.2.21-xenomai+_0.1_i386.deb
  4. make sure it will show up as a GRUB-entry when booting:
    sudo update-initramfs -c -k 3.2.21-xenomai+
    sudo update-grub
  5. reboot. uname -r should now show: 3.2.21-xenomai+
  6. now install the xenomai runtime:
    sudo dpkg -i libxenomai1_2.6.1_i386.deb
    sudo dpkg -i libxenomai-dev_2.6.1_i386.deb
    sudo dpkg -i xenomai-runtime_2.6.1_i386.deb

This installs the xenomai system on top of which a recently available version of LinuxCNC can be built. There are probably many ways to now obtain the tools/dependencies that are required. I used the following:

  1. sudo apt-get install synaptic
    sudo apt-get install git
  2. Now using synaptic, install the following packages (I found these are required for a minimal linuxcnc build):
    build-essential
    autoconf
    libpth-dev
    libglib2.0-dev
    libgtk2.0-dev
    tcl-dev
    tk-dev
    bwidget
    libreadline-dev
    python-tk
    python-dev
    libgl1-mesa-dev
    libglu1-mesa-dev
    libxmu-dev
  3. Get Michael's version of LinuxCNC that can be compiled for Xenomai:
    git clone git://git.mah.priv.at/emc2-dev emc2-dev
    cd emc2-dev
    git branch --track rtos origin/rtos-integration-preview1
    git checkout rtos
  4. Configure and build for Xenomai:
    cd src
    ./configure --with-threads=xenomai-user --enable-run-in-place
    make
    sudo make setuid
  5. Test:
    . ./scripts/rip-environment
    latency-test

This new version of LinuxCNC can be built without a real-time kernel (previously called "simulator" or "sim") or with any of the real-time kernel alternatives: RTAI, Xenomai, RT_PREEMPT. It should be possible to compare real-time performance in the form of latency-numbers with different hardware and kernels.

EMC2 Filters

I hacked together a few python-scripts that can be run as "filters" in EMC2. They are opened/run from AXIS and produce G-code into EMC2.

The first one is ttt2ngc which simply demonstrates my C++ port of Chris Radek's truetype-tracer. The original code is a rather monolithic C-program while my C++ port is divided into smaller files and offers python-bindings and more options (for example arc, cubic, conic output can be turned on/off independently).

The seconds script is ttt2offset which takes ttt-geometry, builds a VD, and produces offsets. By reversing the list of points from ttt either inwards or outwards offsets can be produced. Currently the toolpaths are machined in the order they are produced, i.e. in order of increasing offset value. An improvement would be to order the loops so that for e.g. pocketing the innermost loop is machined first, and rapid-traverses are minimized.


The third script is ttt2medial. Here the VD is filtered down to an (approximate) medial-axis, and the edges of the medial axis are chained together into a toolpath. The chaining-algorithm could probably be improved much, again to minimize rapid-traverses.

If this is run with a V-shaped cutter with a 90-degree angle we can push the cutter into the material by an amount equal to the clearance-disk radius of the edge. This is a "V-carving" toolpath which should produce a cut-out very similar to the outline of the font. For added effect choose a material with  contrasting surface and interior colors.

It would be interesting to know if this v-carving g-code is anywhere near to correct. If someone has a cutting-simulator, or is adventurous enough to run this on an actual machine, I'd be very interested in the results! (here is the g-code: emc2_vcarve.ngc)

Here is a metric version. The max depth is around -3mm, so a 10mm diameter 90-degree V-cutter should be OK. The text should be roughly 100mm long: emc2_vcarve_mm_ver2.ngc

Disclaimer: This is experimental code. Warnings, Errors, and Segfaults are common.

A/B Quadrature from EMC2

By popular demand a simple example of how to modify the stepper_mm sample configuration to output phase-A/phase-B quadrature signals (stepgen type=2).

In core_stepper.hal we specify step type 2, and re-name/wire the stepgen output:

loadrt stepgen step_type=2,2,2

net XA <= stepgen.0.phase-A net XB <= stepgen.0.phase-B net YA <= stepgen.1.phase-A net YB <= stepgen.1.phase-B net ZA <= stepgen.2.phase-A net ZB <= stepgen.2.phase-B

Then in standard_pinout.hal we wire the phases to the parport:

net XA => parport.0.pin-03-out
net XB => parport.0.pin-02-out
net YA => parport.0.pin-05-out
net YB => parport.0.pin-04-out
net ZA => parport.0.pin-07-out
net ZB => parport.0.pin-06-out

Since I have neither a parport nor an oscilloscope at hand right now I'm using some pyvcp LEDs to look at the A/B signals. These are set up with two changes to the INI-file:

[DISPLAY]
PYVCP = phaseleds.xml

and

[HAL]
POSTGUI_HALFILE = pyvcp_phaseleds.hal

The files I'm using are here: phaseleds.tar

Now it is possible to look at the blinking of the LEDs when the machine moves and see the 90-degree out-of-phase square waveform (see also image here).

EMC2 simulator build on Ubuntu 11.10

I thought I would build EMC2-simulator on 64-bit Ubuntu 11.10 following the instructions from the wiki. To get the source and dependencies:

$ git clone git://git.linuxcnc.org/git/emc2.git emc2-dev
$ cd emc2-dev
$ cd debian
$ ./configure sim
$ cd ..
$ dpkg-checkbuilddeps

Then install all the required packages with "sudo apt-get install". dpkg-checkbuilddeps suggests installing tk8.4 and tcl8.4 but I found that in ordet to get the configure-script to run without errors I needed tk8.5, tk8.5-dev, tcl8.5 and tcl8.5-dev, and I removed all the 8.4 packages of tk and tcl. That makes configure run without errors. Then try building:


$ cd src
$ ./autogen.sh
$ ./configure --enable-simulator
$ make

However that produces a number of linking errors. Don't ask me exactly why but this patch: 0001-changes-to-make-sim-build-on-ubuntu-11.10.patch.tar (updated corrected version!) seems to fix things, and I get emc2 sim built and running. Just in case anyone else wants to build on 64-bit Ubuntu 11.10.

EMC2 tpRunCycle revisited

I started this EMC2 wiki page in 2006 when trying to understand how trajectory control is done in EMC2. Improving the trajectory controller is a topic that comes up on the EMC2 discussion list every now and then. The problem is just that almost nobody actually takes the time and effort to understand how the trajectory planner works and documents it...

A recent post on the dev-list has asked why the math I wrote down in 2006 isn't what's in the code, so here we go:

I will use the same shorthand symbols as used on the wiki page. We are at coordinate P ("progress") we want to get to T ("target") we are currently travelling at vc ("current velocity"), the next velocity suggestion we want to calculate is vs ("suggested velocity), maximum allowed acceleration is am ("max accel") and the move takes tm ("move time") to complete. The cycle-time is ts ("sampling time"). The new addition compared to my 2006 notes is that now the current velocity vc as well as the cycle time ts is taken into account.

As before, the area under the velocity curve is the distance we will travel, and that needs to be equal to the distance we have left, i.e. (T-P). (now trying new latex-plugin for math:) (EQ1)

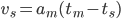
Note how the first term is the area of the red triangle and the second therm is the area of the green triangle. Now we want to calculate a new suggested velocity vs so that using the maximum deceleration our move will come to a halt at time tm, so(EQ2):


Inserting this into the first equation gives (EQ3):


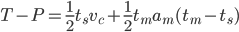
this leads to a quadratic eqation in tm (EQ4):


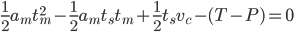
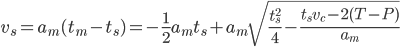
with the solution (we obviously want the plus sign)(EQ5)


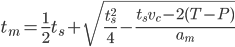
which we can insert back into EQ2 to get (EQ6) (this is the new suggested max velocity. we obviously apply the accel and velocity clamps to this as noted before)


It is left as an (easy) exercise for the reader to show that this is equivalent to the code below (note how those silly programmers save memory by first using the variable discr for a distance with units of length and then on the next line using it for something else which has units of time squared):

discr = 0.5 * tc-&gt;cycle_time * tc-&gt;currentvel - (tc-&gt;target - tc-&gt;progress);
discr = 0.25 * pmSq(tc-&gt;cycle_time) - 2.0 / tc-&gt;maxaccel * discr;
newvel = maxnewvel = -0.5 * tc-&gt;maxaccel * tc-&gt;cycle_time +tc-&gt;maxaccel * pmSqrt(discr);

over and out.