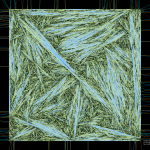
There was an issue with handling collinear line-segments, which is hopefully now fixed. OpenVoronoi seems to deal OK with most characters from ttt now.
I am still getting some Warnings about numerical instability from LLLSolver, possibly related to these high-degree vertices which don't look quite right (this is a zoom-in inside the circular dot of "j" in the picture above):
I should write a class for extracting offsets next. Then perhaps medial axis (if anyone is interested in v-carving toolpaths).
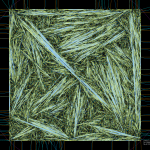
Because my VD code cannot handle circular arcs yet, I took some old code from TTT 3.0 and made converting conics and cubics, the native output of FreeType, as well as arcs into line-segments optional.
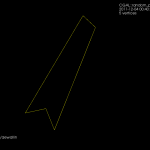
Predictably, OpenVoronoi crashes in many cases, but here is an "L" that works:
I've been hacking away at openvoronoi, adding support for polylines and polygons.
The code I had in November works with individual non-intersecting line segments, like this:
Note how each vertex in the figure above is of degree three, i.e. there are three edges incident on each vertex. There's something about the number three, or triangles, or both, that makes planar graphs of degree three particularly nice to work with.
Here's the same figure with some notes describing the elements. The line-sites are drawn in yellow, and are associated with their left R(L+) and right R(L-) regions. The purple lines are called separators, and they define the region associated with the start- or end-point of a line-site. The three possible edge-types are also shown: LineEdge between two point-sites, LineEdge between two line-sites, and a Parabolic (PointLine) edge between a point-site and a line-site.
Now, things get more complicated when we want to 'glue' two line-segments end-to-end in a polyline, or glue three or more line-segments together to form a polygon. Vertices are not necessarily of degree three any more. In fact the vertex degree is essentially unbounded, as you can start/end arbitrarily many line-segments at the same vertex. The solution I am using is to introduce what I call a null-face with zero-length null-edges around each point-site to which more than one line-segment connects. The mental picture is much like that of a key-chain, or mountaineering carabiners that are hooked-in to a loop. When we want to use the a vertex as a start/end-point for a segment we 'hook-in' to the null-face:
This introduces a number of new rules and associated code for how vertices should be created, removed, and moved around a null-face, but it seems to work somehow now:
Note how these null-faces and the circular null-edges around each end-point result in degree three vertices, which are much nicer to deal with in the algorithm. For example, the null-face around vertex "0" is 40->85->86->41->39. Without the null-face construction this vertex would be of degree five. Here is an annotated version of the same picture:
This image shows how the diagram divides the plane into regions associated with endpoints such as R(0) and with the right/left side of a line-segment such as R(0-29) and R(29-0). The null-edges that form null-faces around each end-point are drawn in white.
Of course, these null-edges are only a topological construction. Geometrically we can position each vertex on a null-face at the location of the encircled point-site. This effectively contracts away the zero-area null-faces, and the result is the diagram we want:
The code now runs for a few select test-cases. To be continued...
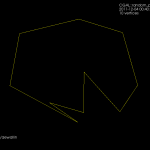
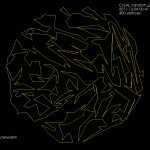
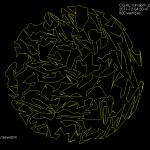
Update: The code now seems to work also for random polygons with a large number of vertices. Here is one with 400 vertices:
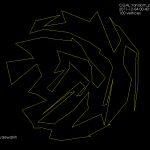
and 3200-vertices:
For profiling I made a small c++ program which calculates a poisson voronoi diagram. When called through valgrind like this (under valgrind the program will run roughly 50 times slower than normal) valgrind --tool=callgrind -v ./ovd_tst --n 1000
I can then use kcachegrind to draw a call graph.
I thought the nearest-neighbor grid-search (grid_find_closest_face()) would cost much more than it does.
The callee map may in fact better visualize where CPU time is spent:
The map changes significantly if we change the solver number type to double, which is faster but less accurate. A better strategy might be to run the fast solver(double) first, then check the quality of the solution, and run the slow solver(qd_real) only if necessary.
In this map there doesn't seem to be an obvious bottleneck or 'hot spot' in immediate need of optimizing, since there are 6-8 blocks/functions each taking roughly 10% of the CPU time.
After some tweaking the benchmark (with the double solver) run gives these results:
On g+, John Baez linked to work by Henk Hilhorst on the probability of finding voronoi cells with n sides in a poisson voronoi diagram.
A poisson voronoi diagram has point sites randomly and uniformly distributed, like this:
Here's the distribution I came up with, after counting the edges for each voronoi cell from 200 runs where openvoronoi generated the diagram for 100k point-sites in each run. The green line is Hilhorst's prediction. I'm assuming poisson statistics, so if the bin-count for a certain n is fn, I've drawn errorbars of length sqrt(fn). Cells with n=15 or n=16 are so rare that the statistical error is of the same size as the probability (but it does agree with Hilhorst's prediction). Among the 20M cells I looked at I did not find n >= 17. For n=17 the predicted probability is 2e-9, so there's should be a 50% chance of seeing one if I would produce 500M random cells (that would take about 7 hours of CPU time).
The relevant papers are
http://arxiv.org/abs/cond-mat/0507567 "Asymptotic statistics of the n-sided planar Poisson-Voronoi cell: I. Exact results", Journal of Statistical Mechanics: Theory and Experiment -- (2005) P09005
http://arxiv.org/abs/0903.3466 "Asymptotic statistics of the n-sided planar Voronoi cell: II. Heuristics", Journal of Statistical Mechanics: Theory and Experiment -- (2009) P05007
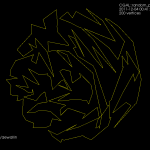
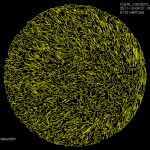
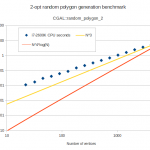
I wrote a minimal boost::python wrapper around this function in order to test it and draw the polygons using vtk. Here are some examples of random polygons with randomly placed vertices inside the unit circle:
The one with 8k vertices takes 150 seconds of i7-2600K CPU time to generate. The worst-case running time of this algorithm is slow, O(n^4 log n), but it practice it seems better than O(n^3):
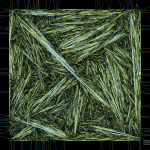
Update3: version 11.10-148 now goes to 16k line-sites without errors or warnings:
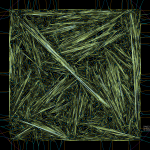
Update2: This diagram with 8k vertices clearly has errors:
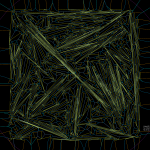
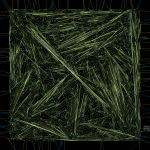
Update: Version 11.10-141 now copes with 4k random segments. But I don't know of any smart way to check the diagram for correctness..
Constructing the vd for random (non-crossing) line-segments is a reasonable stress-test for my vd-algorithm. When you've fixed one bug, just increase the number of line-segments by a factor of two and you will most likely uncover another! It now runs OK up to 2048 line-segments (yes, that does imply I get a segfault at 4096!).
There's some slowdown from 5us*n*log(n) in september 2011 (for just point-sites), to this code which runs in about 15 to 20us*n*log(n) when inserting the point-sites. Line-sites take longer, about 200us*m*log(m) for m line-sites.
I've made some more progress with my voronoi diagram code. I described the topology-oriented incremental algorithm earlier here (point sites) and here (line segments). When we want to add a new site (a point or a line-segment) to the diagram we should find a tree of to-be-deleted vertices/edges (red), create new (green) vertices on all in-out edges, and hook up the new vertices with new edges (green) to form the face for the new site. For point sites it looks like this(click thumbnail to see GIF animation!):
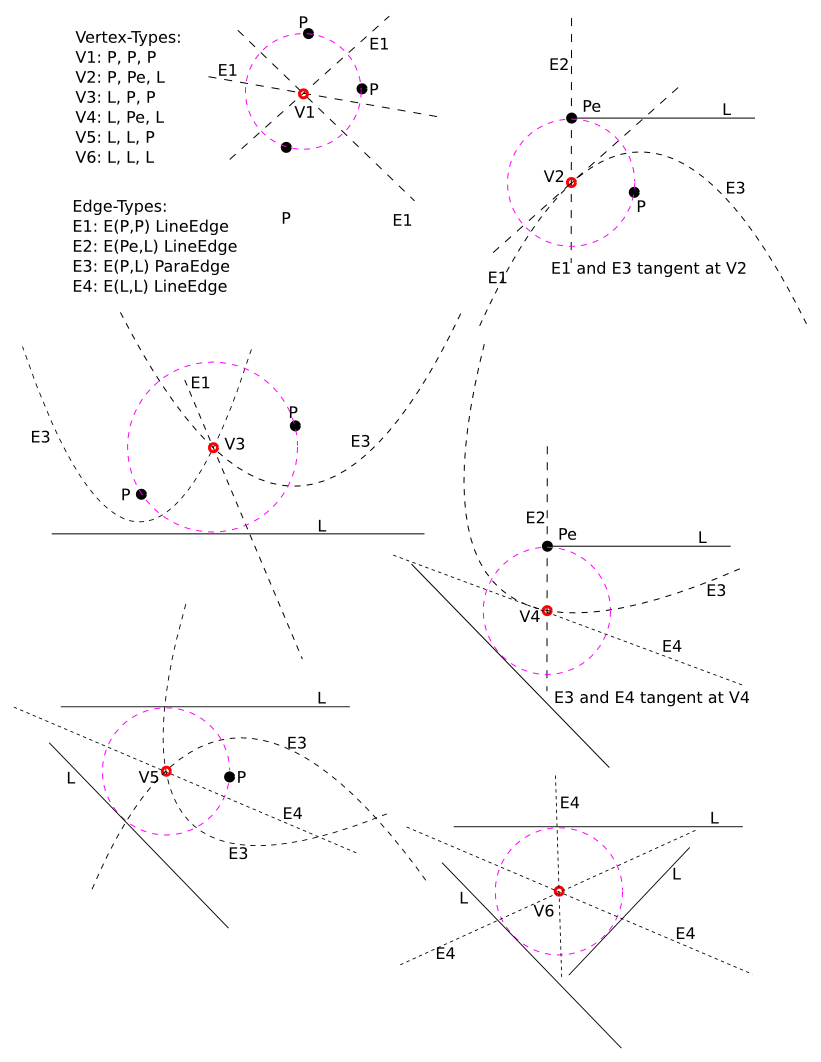
For line-segment sites we need to modify the in_circle() predicate to calculate the minimum distance from a point to a line-segment. Then we need a much more involved solver that figures out points that are equidistant from points/lines. There are four different cases: point/point/point, point/point/line, point/line/line, and line/line/line (or you could identify a fifth and sixth type of vertex if you treat the case where one vertex is a line-segment endpoint differently, see drawing here).
In addition to simple line-edges between two point-sites we now also get two new types of edges: between line/line sites we have line-edges (but parametrized a little differently), and between point/line sites we have parabolic edges. The basic algorithm however looks pretty similar: we again find the delete-tree (red), create new vertices (green), and hook them up with new edges (green) to form a new face. (again click thumbnail to see GIF animation!).
There are (at least!) two more complications arising with line-sites that don't show up with just point-sites. These are handled with additional APEX and SPLIT vertices, which don't really add new geometry or topology to the diagram, they just make the algorithm handle certain special cases correctly.
It turns out that with parabolic edges there can be cases where both endpoints of the edge are marked IN (red, or to-be-deleted), but some parts of the edge still needs to be preserved. To handle this case correctly we insert a new type of APEX vertex at the apex of each parabolic edge. These APEX vertices can be seen at the tip of each parabola in the GIF-animation above.
The second special case is more subtle. There can be situations where the algorithm finds a to-be-deleted set of vertices that contains a loop/cycle. This is obviously forbidden because that would delete a face from the graph - which isn't allowed. That's why we require the delete-set to be a tree. Here is an image:
We are inserting a new line-segment (yellow) starting at 48. The IN-vertices already found are colored red. Vertex 142 should be marked IN because it is closer to the new line-segment than to any other site. However that would create a loop of red vertices (134-135-143-148-142-138) and the face corresponding to the point-site 133 would be deleted. The problem is similar to that with APEX points: the end-points of edge 148-142 are both marked IN, but the edge should not be deleted completely. To handle this case we need to insert a SPLIT vertex at a position on the 148-142 edge which will be preserved(i.e. marked OUT). We do this by projecting the site 133 onto the edge 148-142 using the line-segment(yellow) as a mirror. This vertex will be marked OUT and ensures that the 148-142 edge is not completely removed. The same reasoning should work for circular arc-sites where we project radially through the center of the arc.
Here is a longer animation (best watched at 1080p/fullscreen!) which shows the insertion of 100 point-sites followed (after around 1:15) by insertion of (non-crossing!) line-segments:
The code now runs without errors until about 50 line-segments. There are problems with finding the proper end-points for separators in degenerate cases where the solver positions vertices on top of each other or very very close to each other.
Update: Some further bugfixes and filtering solution-points by both maximum and minimum t-value (clearance disk radius) has made the code run without assert()'s or problems up to N=100 line-segments:
Update2: now up to 200 line-sites:
Update3: Here is one case which I have identified as "hard" for the vd-vertex location solver code. We have as input to the solver a line-segment, one of its endpoints, and a third site (in this case also a line-segment). In some cases it happens that the offsets (dashed lines) of these three input sites are nearly parallel, which results in bad numerical precision, and the resulting solution can have an error which is as much as 1e9 times the normal errors I see.
I've made some progress with my voronoi diagram code:
Sites/generators in yellow. Line-edges in cyan, parabolic edges in red. Note that the parabolic edges are split at their apex, i.e. the closest point to the adjacent site.
Some problems with hooking up the half-edges of the two new faces that are associated with a new line-site remain. Hopefully soon to be fixed.
This code should in principle work for circular arc sites too. Adding arcs to the diagram results in elliptic and hyperbolic edges (in addition to line and parabola, which seem to work now).


