For profiling I made a small c++ program which calculates a poisson voronoi diagram. When called through valgrind like this (under valgrind the program will run roughly 50 times slower than normal)
valgrind --tool=callgrind -v ./ovd_tst --n 1000
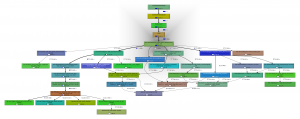
I can then use kcachegrind to draw a call graph.
I thought the nearest-neighbor grid-search (grid_find_closest_face()) would cost much more than it does.
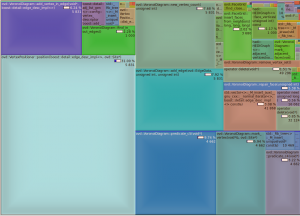
The callee map may in fact better visualize where CPU time is spent:

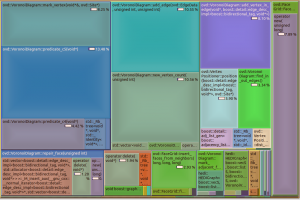
The map changes significantly if we change the solver number type to double, which is faster but less accurate. A better strategy might be to run the fast solver(double) first, then check the quality of the solution, and run the slow solver(qd_real) only if necessary.

In this map there doesn't seem to be an obvious bottleneck or 'hot spot' in immediate need of optimizing, since there are 6-8 blocks/functions each taking roughly 10% of the CPU time.
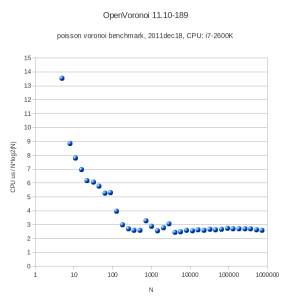
After some tweaking the benchmark (with the double solver) run gives these results:

