On g+, John Baez linked to work by Henk Hilhorst on the probability of finding voronoi cells with n sides in a poisson voronoi diagram.
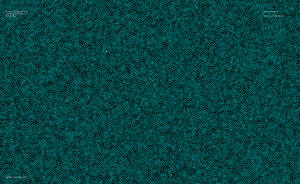
A poisson voronoi diagram has point sites randomly and uniformly distributed, like this:

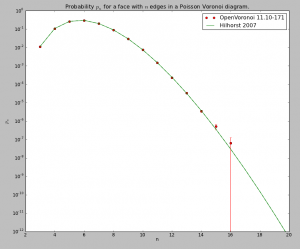
Here's the distribution I came up with, after counting the edges for each voronoi cell from 200 runs where openvoronoi generated the diagram for 100k point-sites in each run. The green line is Hilhorst's prediction. I'm assuming poisson statistics, so if the bin-count for a certain n is fn, I've drawn errorbars of length sqrt(fn). Cells with n=15 or n=16 are so rare that the statistical error is of the same size as the probability (but it does agree with Hilhorst's prediction). Among the 20M cells I looked at I did not find n >= 17. For n=17 the predicted probability is 2e-9, so there's should be a 50% chance of seeing one if I would produce 500M random cells (that would take about 7 hours of CPU time).

The relevant papers are
- http://arxiv.org/abs/cond-mat/0507567 "Asymptotic statistics of the n-sided planar Poisson-Voronoi cell: I. Exact results", Journal of Statistical Mechanics: Theory and Experiment -- (2005) P09005
- http://arxiv.org/abs/0903.3466 "Asymptotic statistics of the n-sided planar Voronoi cell: II. Heuristics", Journal of Statistical Mechanics: Theory and Experiment -- (2009) P05007
- http://arxiv.org/abs/0709.0347 Statistical properties of planar Voronoi tessellations
- http://dx.doi.org/10.1088/1751-8113/40/11/002 New Monte Carlo method for planar Poisson–Voronoi cells
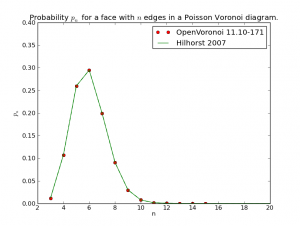
The logarithmic y-axis hides the fact that the distribution is very peaked around n=6, so here is a plot with a linear y-axis:
