AllanTools 2016.11 - now with Confidence Intervals!

at2016-11_wtih_ci

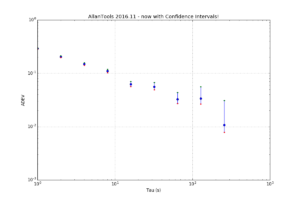
I've added confidence interval estimation to allantools, based on a 2004 paper by Greenhall & Riley: "Uncertainty of stability variances based on finite differences"

So far not much is automated so you have to run everything manually. After a normal call to allantools.adev() to calculate the ADEV we loop through each (tau, adev) pair and first call allantools.edf_greenhall() to get the number of equivalent-degrees-of-freedom (EDF), and then evaluate a confidence interval with allantools.confidence_interval(). A knowledge or estimate of the noise type "alpha" is required for edf_greenhall() - here we just assume alpha=0.

This example is on github at: https://github.com/aewallin/allantools/blob/master/examples/ci_demo.py

import numpy
import matplotlib.pyplot as plt
 
import allantools as at
 
# this demonstrates how to calculate confidence intervals for ADEV
# using the algorithms from Greenhall2004
data_file = '../tests/phasedat/PHASE.DAT'
 
def read_datafile(filename):
    p = []
    with open(filename) as f:
        for line in f:
            if not line.startswith("#"):  # skip comments
                p.append(float(line))
    return p
 
# read input data from file
phase = read_datafile(data_file)
# normal ADEV computation, giving naive 1/sqrt(N) errors
(taus,devs,errs,ns) = at.adev(phase, taus='octave')
 
# Confidence-intervals for each (tau,adev) pair separately.
cis=[]
for (t,dev) in zip(taus,devs):
    # Greenhalls EDF (Equivalent Degrees of Freedom)
    # alpha     +2,...,-4   noise type, either estimated or known
    # d         1 first-difference variance, 2 allan variance, 3 hadamard variance
    #           we require: alpha+2*d >1     (is this ever false?)
    # m         tau/tau0 averaging factor
    # N         number of phase observations
    edf = at.edf_greenhall( alpha=0, d=2, m=t, N=len(phase), overlapping = False, modified=False )
    # with the known EDF we get CIs 
    # for 1-sigma confidence we set
    # ci = scipy.special.erf(1/math.sqrt(2)) = 0.68268949213708585
    (lo,hi) = at.confidence_intervals( dev=dev, ci=0.68268949213708585, edf=edf )
    cis.append( (lo,hi) )
 
# now we are ready to print and plot the results
print "Tau\tmin Dev\t\tDev\t\tMax Dev"
for (tau,dev,ci) in zip(taus,devs,cis):
    print "%d\t%f\t%f\t%f" % (tau, ci[0], dev, ci[1] )
""" output is
Tau	min Dev		Dev		Max Dev
1	0.285114	0.292232	0.299910
2	0.197831	0.205102	0.213237
4	0.141970	0.149427	0.158198
8	0.102541	0.110135	0.119711
16	0.056510	0.062381	0.070569
32	0.049153	0.056233	0.067632
64	0.027109	0.032550	0.043536
128	0.026481	0.033855	0.055737
256	0.007838	0.010799	0.031075
"""
plt.figure(figsize=(12,8))
plt.gca().set_yscale('log')
plt.gca().set_xscale('log')
err_lo = [ d-ci[0] for (d,ci) in zip(devs,cis)]
err_hi = [ ci[1]-d for (d,ci) in zip(devs,cis)]
 
plt.errorbar(taus, devs, yerr=[ err_lo, err_hi ] ,fmt='o')
plt.grid()
plt.xlabel('Tau (s)')
plt.ylabel('ADEV')
plt.title('AllanTools 2016.11 - now with Confidence Intervals!')
# just to check plot the intervals as dots also
plt.plot(taus, [ci[0] for ci in cis],'r.')
plt.plot(taus, [ci[1] for ci in cis],'g.')
 
plt.show()

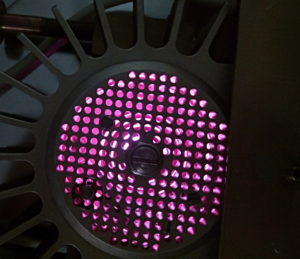
Ettus OctoClock distribution amplifier

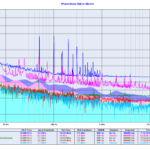
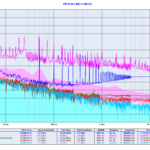
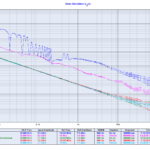
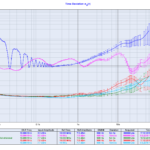
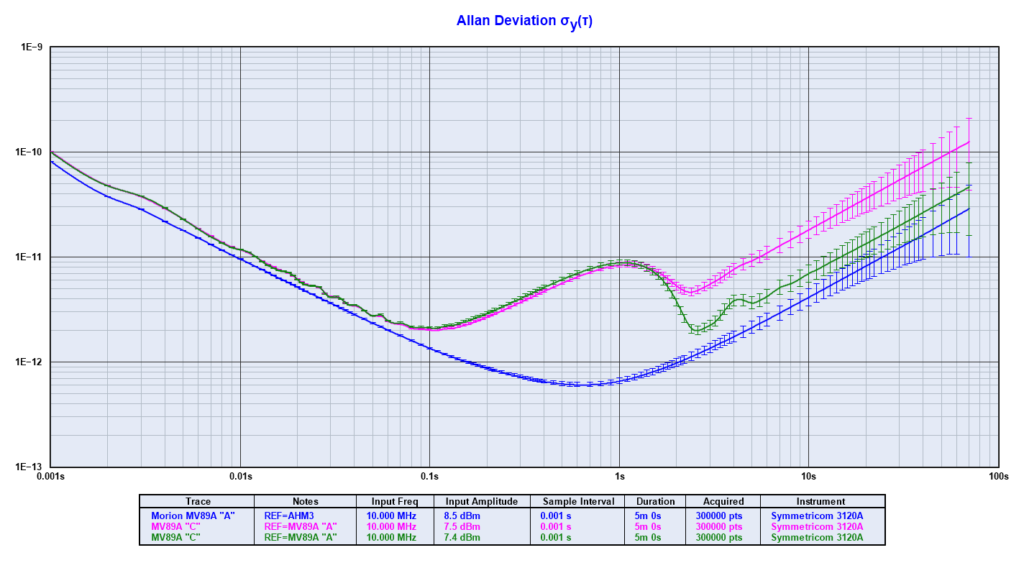
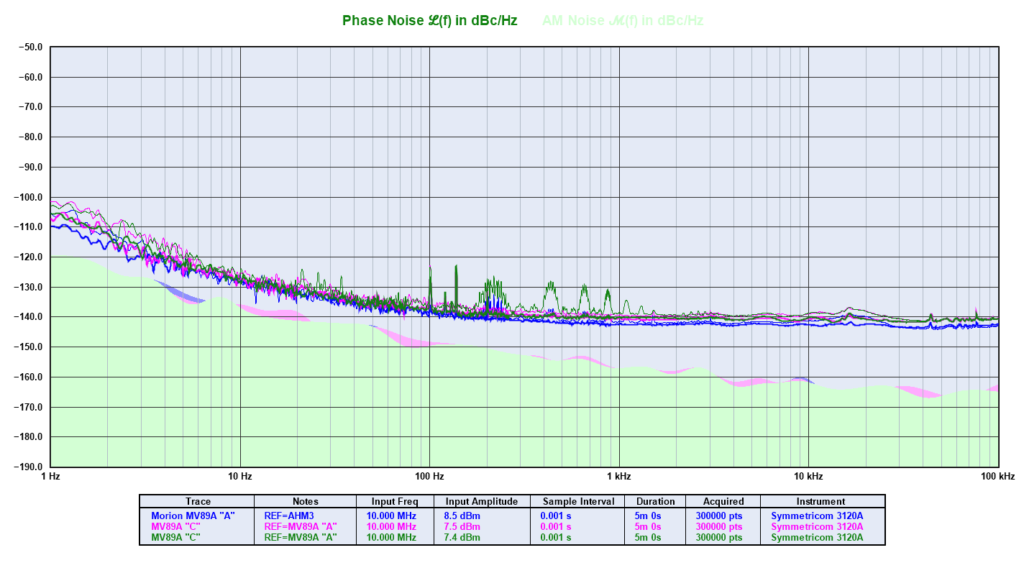
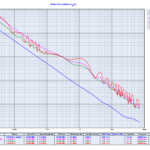
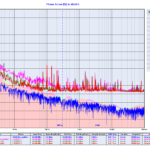
I measured the phase-noise of an Ettus OctoClock distribution amplifier. These plots compare it to earlier measurements on an SRS FS710 and a Symmetricom 6502 as well as my own TADD-1 inspired AD8055 prototype.

OctoClock schematic here: http://files.ettus.com/schematics/octoclock/octoclock.pdf

10 MHz clock-distribution chip: http://www.ti.com/lit/ds/symlink/cdce18005.pdf

For time-nuts kind of stuff (H-masers!) the 10 MHz phase-noise doesn't look that great, and there is something funky going on in the AM noise!? The box is powered by a +6 VDC wall-wart PSU which is probably the cause of all those spikes...

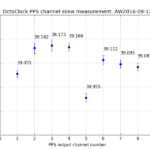
The PPS-channels are based on 7404 hex-inverters and look OK. 200ps of skew is equivalent to 4 cm of trace-length (?) - which seems like a lot if there was an effort to minimize it... For a 1 V/ns rise-time pulse 200ps is equivalent to 200mV of DC-offset in either the signal or the counter trigger-level which also seems like a lot?

PICDIV frequency divider

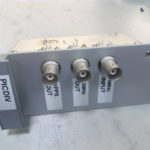
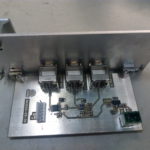
I put together a PICDIV frequency divider for use with a Rubidium clock.

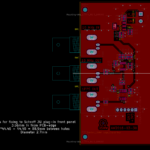
I used an LTC6957-3 to convert the 10 MHz sine-wave from the clock to a CMOS logic signal (square wave). The LTC6957-3 has two outputs, one is routed to a BNC connector output, the other is used as the clock for a PIC12F675. The PIC runs pd09.asm which outputs a 20 us long pulse every second - i.e. it divides the 10 MHz input frequency by 1e7. The PIC is programmed through a 5-pin 100 mil ICSP header.

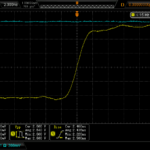
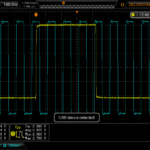
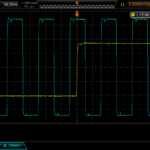
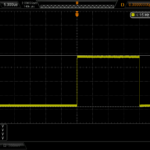
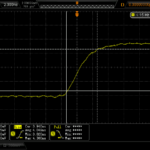
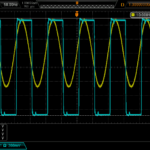
Here are some test-signals with a SRS PRS-10 as the source, and recorded on a Rigol scope.

The outputs behave as expected, but the 1PPS from the PIC is only 700 mVpp into 50R - a bit low. When terminated to 1 MOhm the rise-time is much worse so this is best avoided. Perhaps a buffer or level-translator would be a good addition.

Finally phase-noise measurements on the 10 MHz CMOS output, performed with a 3120A phase-noise probe.

I tried shielding the circuit with aluminium foil and powering it from a +12 VDC lead-acid battery - however the three measurement runs look roughly similar. Perhaps the LM317 regulator is not a great choice here, and both the LTC sine-to-square chip and the PIC should have more bypass caps and decoupling (inductors, ferrites?). In any case the phase-noise is 10-20x better than the measurement noise from a typical counter (SR620 or 53230A), so any issues only show up with high-end phase-noise probes.

Five colours of noise

Update: now with the colours matching in all graphs:

colorednoise

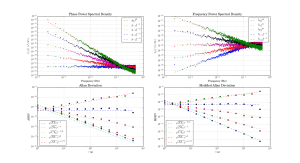
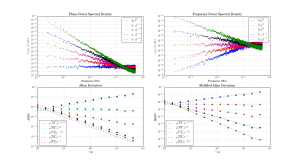
Time-series generated with colorednoise (following Kasdin&Walter), power-spectral-densities and Allan deviations computed with allantools, and compared to theoretical predictions in IEEE1139-2008.

colorednoise

The PSD lines and MDEV lines seem spot-on, but are the ADEV lines systematically a bit low?

Code here: example_noise_slopes.py

Hadamard total deviation in allantools

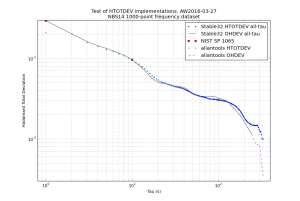
Following on from modified total deviation mtotdev() the Hadamard total deviation htotdev() algorithm is very similar but instead of phase data takes frequency data. Now included in allantools.

Here's a comarison against Stable32 and the NIST SP 1065 table values.

There's no bias-correction for now, and apparently it is customary not to use htotdev(m=1) at an averaging-factor of 1, but instead use ohdev(m=1). This is why the 'raw' value from allantools at tau=1 in the plot below is a factor of 2 too low.

htotdev_2016-03-27Both mtotdev() and htotdev() are very slow algorithms - help with making them faster would be appreciated!

Modified Total Deviation in allantools

I wrote a first rough (and very slow!) implementation of Modified Total Deviation mtotdev() for allantools.

mtotdev() combines the features of modified Allan deviation mdev() (being able to distinguish between white and flicker phase modulation) and Total deviation totdev() (better confidence intervals at large tau).

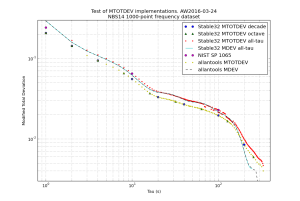
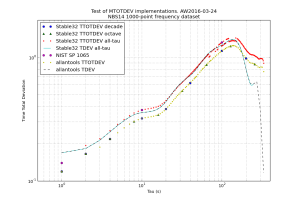
Here are some results. The Time Total Deviation ttotdev() follows trivially from this work also, since it is only a scaled version of mtotdev(). I used the "NBS14" 1000-point frequency dataset and compared my results against Stable32 and those in NIST SP 1065 (Table 31, page 108).

mtotdev_comparison_AW2016-03-24

ttotdev_comparison_AW2016-03-24

The figures show mtotdev() and ttotdev() from Stable32 runs and allantools. I've also added mdev() and tdev() traces to compare against. At first sight this looks strange, but mtotdev() is a biased estimator, and Stable32 applies a bias correction which explains the results.

Somewhat surprisingly Stable32 applies a bias-correction only when run in the "all-tau" mode. These numbers agree with those from the NIST SP 1065 table. For this dataset Stable32 is undecided on what power-law the dataset follows at large tau, which results in deviations that jump up and down (because a different bias-correction is applied at different tau, red datapoints).

When Stable32 is run in "octave-tau" or "decade-tau" mode no bias correction is applied. These numbers agree with the ones from allantools.mtotdev().

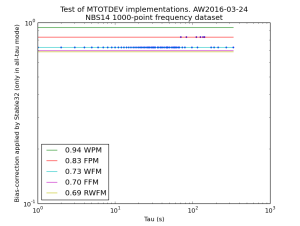
mtotdev_bias_AW2016-03-24

This figure shows the ratio of variances between allantools.mtotdev() (no bias correction) and a Stable32 all-tau run (bias correction applied). The lines correspond to the bias-correction values for different noise processes.

There also seems to be a misprint in NIST SP 1065 equation (28) page 26, where it says ttotdev() is scaled by tau-cubed (when tau-squared is correct). Who reads these things anyway - not many it seems 😉