Jämsä-Jukola statistics

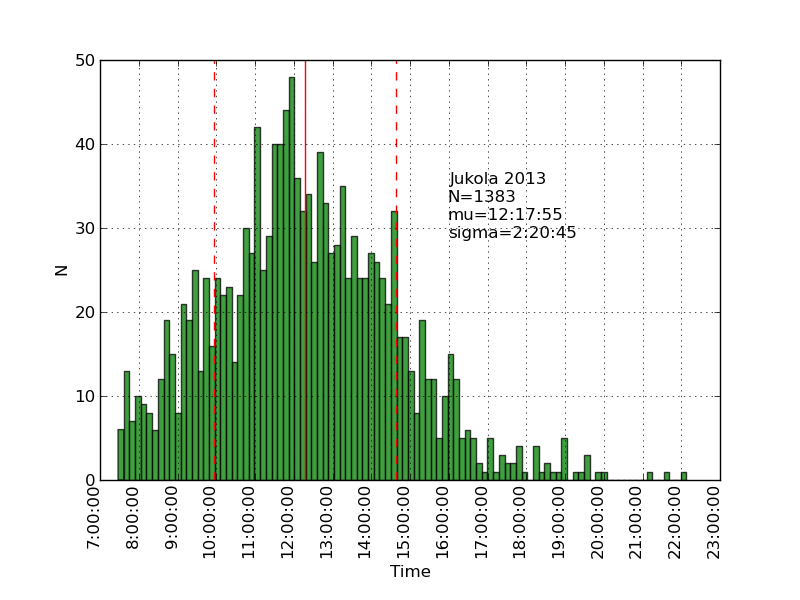
Here's the distribution of total time for teams in the Jämsä-Jukola relay:

Jukola 2013_fig

Here are the distributions of individual times for the seven legs of the relay.

Jukola 2013, 1st leg, 12.2 km_fig

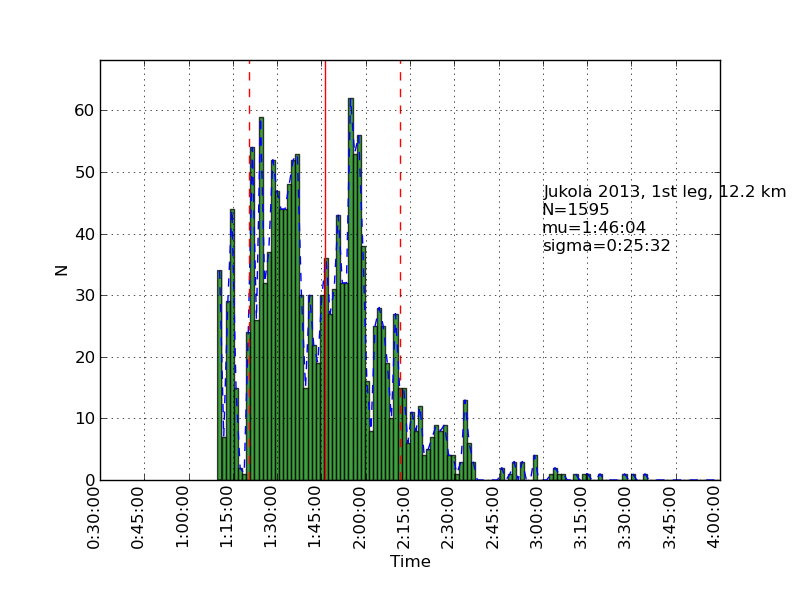
The histogram from the first leg shows bunching of runners into groups - this is different from all the remaining legs.

Jukola 2013, 2nd leg, 13.0 km_fig Jukola 2013, 3rd leg, 14.4 km_fig
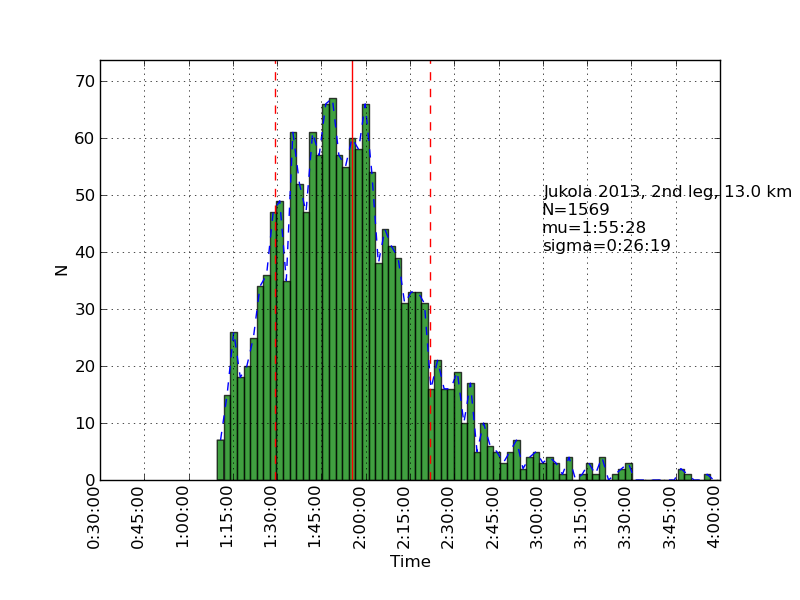
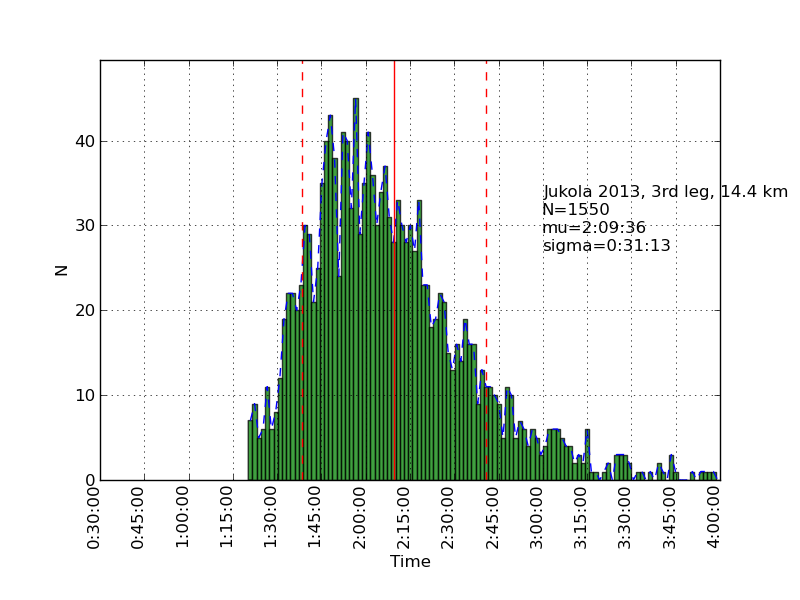
The 2nd and 3rd leg look quite similar. Note how the histograms lean to the left - there are many amateurs of varying ability which contribute to the long tail to the right.

Jukola 2013, 4th leg, 7.8 km_fig Jukola 2013, 5th leg, 7.7 km_fig

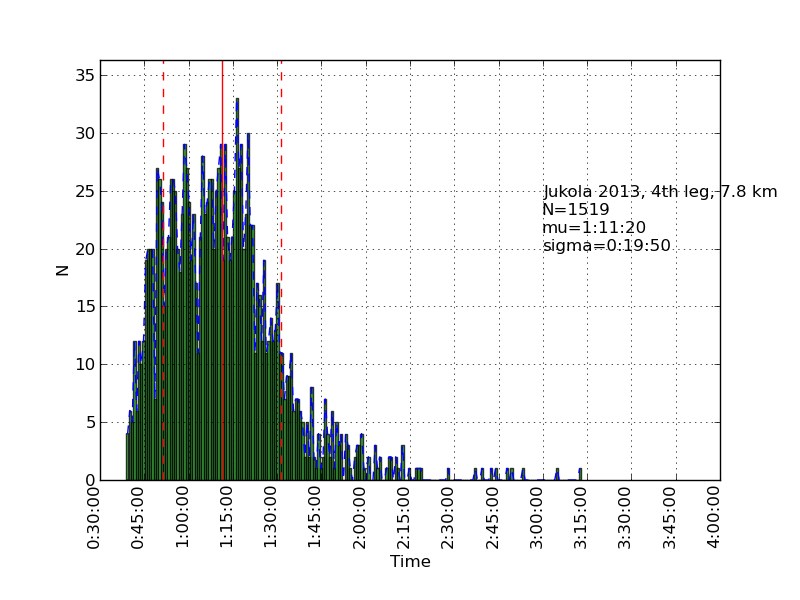
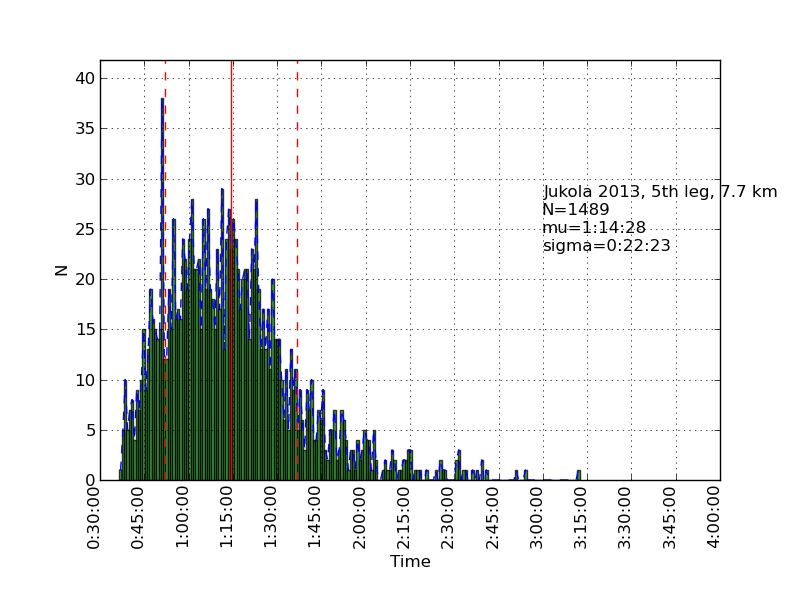
The 4th and 5th legs are shorter and faster.

Jukola 2013, 6th leg, 11.7 km_fig Jukola 2013, 7th leg, 15.1 km_fig
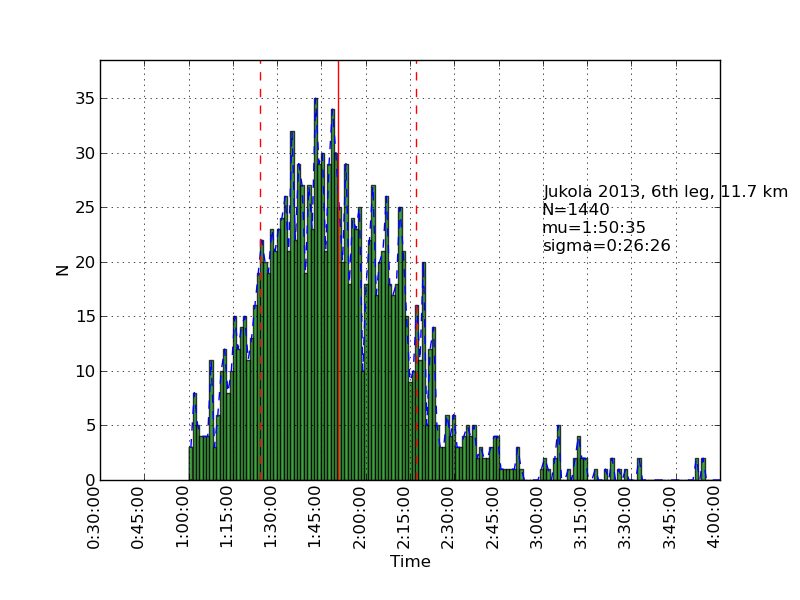
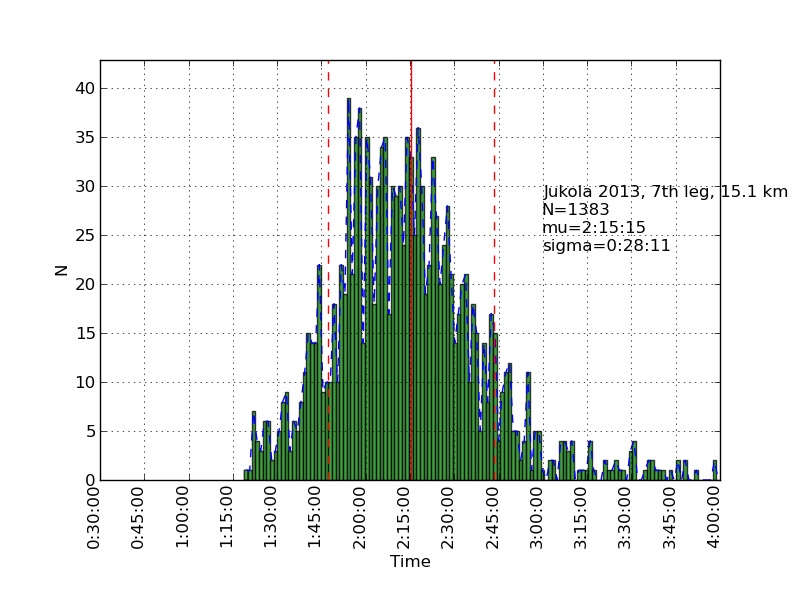
The 6th leg is again longer with the final 7th leg being the longest of them all.

Scraping scripts (requires minor modifications to downloaded results html file): jukola_scrape

HCR2011 statistics

Using the same scraping scripts I wrote after last years marathon, it was fairly easy to scrape the HCR website and produce some histograms.

There are two python scripts, one that crawls the web (urllib) and finds the time-data (BeautifulSoup and re) and writes to a file (cPickle), and another that reads the files and plots (matplotlib) histograms: hcr2011_scrape


Helsinki City Marathon

Been there, done that, have the medal, have the T-shirt!

It was hot and it was humid. I also had a strange ache in both my knees and my ankles which towards the end made each step forward painful. I was doing OKish through 30km and a bit further, but after that the walks at the drinking stations became longer, and I walked the uphills towards the end. Finished in 4h 42min. The breakup into 20k/10k/5k times shows how I got more tired towards the end:

The first 20k took 2h1min and the second 2h 23min.

The first 10k took 59min, 2nd 62min, 3rd 67min, and 4th 76min.

5k times: 29min, 30min, 30min, 31min, 33min, 34min, 36min, 40min

Temp(left) and humidity(right) data from FMI for around 15-19 o'clock shows T=23-25 C and RH=70-80% at least.

In colder weather, with a bit more training, and without the knee-ache, the next goal must be to break 4h!

Update: the finishing times are distributed like this:

This histogram was produced by scraping the results website with one python script and the plotting the results with another.

Download the scripts hcm_scrape.tar (works on Ubuntu 10.04LTS) hcm_scrape.tar

A whole series of histograms are on picasa: http://picasaweb.google.com/anders.e.e.wallin/HCM2010Statistics#