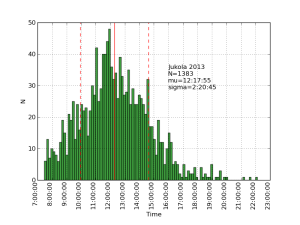
Here's the distribution of total time for teams in the Jämsä-Jukola relay:
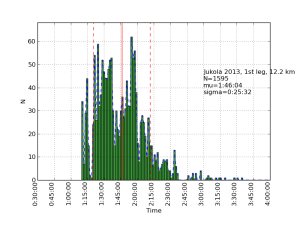
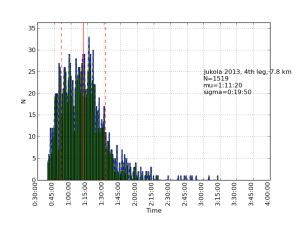
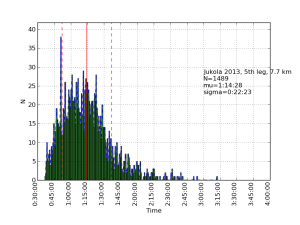
Here are the distributions of individual times for the seven legs of the relay.
The histogram from the first leg shows bunching of runners into groups - this is different from all the remaining legs.
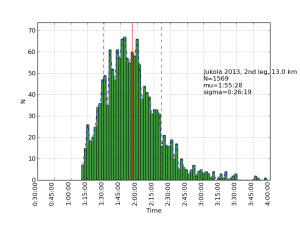
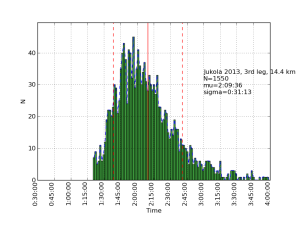
The 2nd and 3rd leg look quite similar. Note how the histograms lean to the left - there are many amateurs of varying ability which contribute to the long tail to the right.
The 4th and 5th legs are shorter and faster.
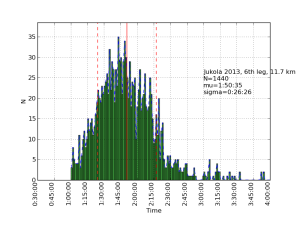
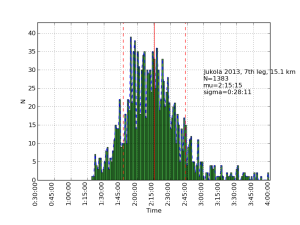
The 6th leg is again longer with the final 7th leg being the longest of them all.
Scraping scripts (requires minor modifications to downloaded results html file): jukola_scrape
