Some more youtube-art:
Tag: voronoi
VD algorithm animation
Some notes on the Sugihara&Iri 1994 topology-based algorithm for incremental construction of the voronoi diagram for point sites.
(A) We start with initial VD for point sites that have already been inserted. We want to insert a new site, shown as a yellow sphere.
(B) We then find the VD face to which the new vertex belongs. Among the vertices that bound this face we search for a seed-vertex, shown in pink. This is the vertex that is closest to the new generator.
(C) From the seed vertex, we search for more vertices that should be deleted(red). The vertices should form a tree (a connected, acyclic graph). Vertices that are closer to the new site than to any other site should be deleted. However due to floating-point errors it's not possible to blindly rely on an inCircle() predicate for finding the delete-tree. It's necessary to also enforce the correct topology, namely (i) the delete-vertices should form a tree, and (ii) for any incident face, the delete-vertices are connected. This ensures that no old face of the graph is deleted or split in two.
(D) Identify the edges to be deleted (red), and edges on which we need to generate new vertices (green).
(E) Generate new vertices on the green edges, and connect all the new vertices by new edges. These new edges form a new face corresponding to the newly inserted site.
(F) Remove the red/delete-vertices and edges. We are left with what we want: the VD of all the old sites and the new site.

Another picture from the original 1994 paper. The new site is not shown, but by some process we have found the delete-tree (u1,u2,u3,u4) shown as solid dots. New vertices are then generated on the "in-out" edges (u2-u10, u2-u5, u3-u6, u3-u7, u4-u8, u4-u9), shown as unfilled dots. The unfilled dots are connected with new edges (dashed lines) that form the new facet (shaded area). Image borrowed from: Sugihara&Iri 1994.

Here is an animation of the algorithm at work when inserting about 100 random points:
VD animation
VD shapes
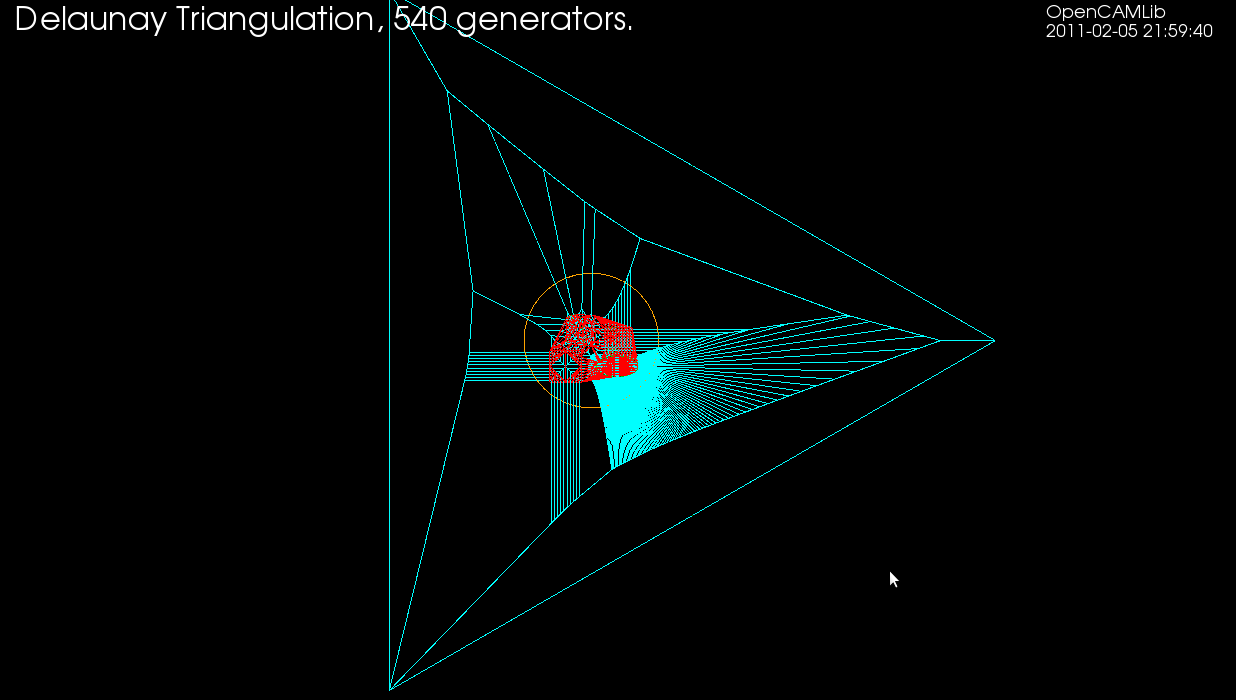
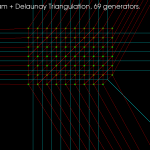
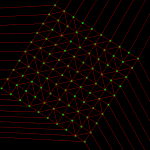
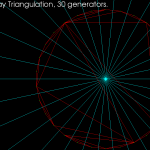
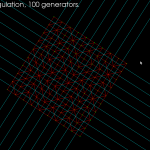
Note how the Delaunay triangulation (in red) is not correct. The outside of true Delaunay triangulation should form the convex hull of the input points, which is clearly not the case here(see how the red lines around the ellipse-shape are not tangents). What's going wrong? It has to do with how the algorithm avoids infinite or unbounded voronoi-edges. Before any real input generator points are inserted we start with three special generator vertices and the corresponding vd. A zoomed out view is shown below. If the cyan vd edges extending outward from the ellipse would stretch out to infinity then we would indeed recover the true Delaunay triangulation. The Voronoi diagram should however be correct inside the orange circle. I'm not sure how the true Delaunay triangulation could constructed with this algorithm.
VD pics
Some progress on the voronoi-diagram algorithm. It doesn't crash easily now with random or regular input points. Not crashing is good, but whether the output converges towards the correct diagram or not remains to be seen...
Voronoi diagram error
Playing around with the vd-code has highlighted some problems. Using double-precision floating point numbers for coordinates, strange things start to appear when the coordinates are around 1E-6 or so. It's not possible to accurately compute the sign of the in-circle predicate (a 4x4 determinant) and the diagram update should instead be based on topological reasoning.

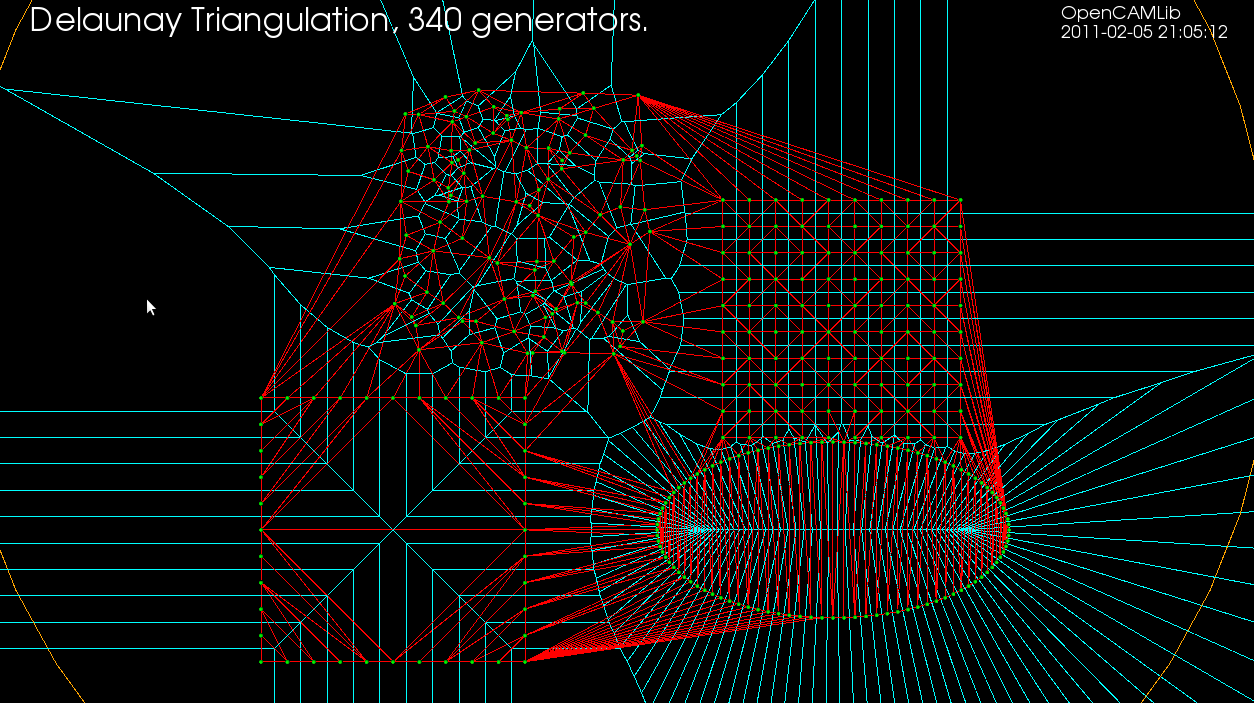
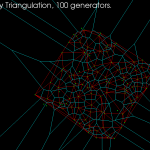
Delaunay Triangulation
The dual of the Voronoi diagram is the Delaunay triangulation. Here I've modified my earlier VD code to also output the dual (shown in red). If this can be developed further to do constrained Delaunay triangulations (arbitrary pockets with islands) then it will be useful for cutter-location surfaces in opencamlib.
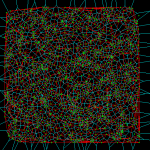
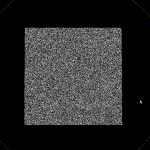
The regular grid is, in the words of the GTS website, "a much more difficult test than it looks".
100k sites voronoi diagram
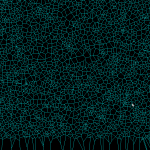
With a bucketing-scheme for nearest-neighbour search in expected time O(1) this voronoi-diagram generation for 100k sites in the [0,1] unit square now runs in 30 s, i.e. it takes about 0.3 ms to insert one point.
Voronoi diagram algorithm
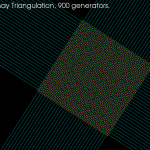
Update: now seems to work for at least 10k generators:

and a zoom-in of the same picture:

One way to compute 2D offsets for toolpath generation is via the voronoi diagram. This video shows the first (somehow) working implementation of my code, which is based on papers by Sugihara and Iri. Their 1992 paper is here: http://dx.doi.org/10.1109/5.163412, then a longer 50-page paper from 1994 here: http://dx.doi.org/10.1142/S0218195994000124, and then there's a more general description of the topology-based approach from 1999 here 10.1007/3-540-46632-0_36, and from 2000 here: http://dx.doi.org/10.1007/s004530010002
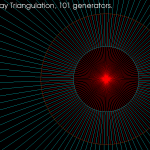
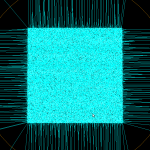
The algorithm works by incrementally constructing the diagram while adding the point-generators one by one. This initial configuration is used at the beginning:

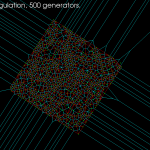
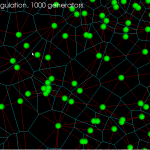
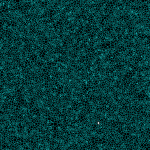
The diagram will be correct if new generator points are placed inside the orange circle (this way we avoid edges that extend to infinity). Once about 500 randomly chosen points are added the diagram looks like this:

Because of floating-point errors it gets harder to construct the correct diagram when more and more points are added. My code now crashes at slightly more than 500 generators (due to an assert() that fails, not a segfault - yay!). It boils down to calculating the sign of a 4-by-4 determinant, which due to floating-point error goes wrong at some point. That's why the Sugihara-Iri algorithm is based on strictly preserving the correct topology of the diagram, and in fact they show in their papers that their algorithm doesn't crash when a random error is added to the determinant-calculations, and it even works (in some sense) when the determinant calculation is completely replaced by a random number generator. Their 1992 paper constructs the diagram for one million generators using 32-bit float
numbers, while my naive attempt using double here crashes after 535 points... some work to do still then!
CAM toolpaths tend to be based on CAD-geometry in the form of lines, circular arcs, or spline-curves and such. One way forward is to think of a curve as a lot of closely spaced points along the curve. There are also papers which describe how to extend the algorithm for line and arc generators. See the 1996 paper by Imai. There is FORTRAN code for this by Imai over here (I haven't looked at it or tried compiling it...). Held et al. describe voronoi diagram generation for points and lines in 2001: http://dx.doi.org/10.1016/S0925-7721(01)00003-7 and for points, lines, and arcs in 2009 http://dx.doi.org/10.1016/j.cad.2008.08.004. This pic from the Held&Huber 2009 paper shows point, line, and arc generators in bold-black, the associated voronoi-diagram as solid lines, and offsets as grey lines.

Held has more pictures here: http://www.cosy.sbg.ac.at/~held/projects/pocket_off/pocket.html
Note how within one voronoi-region the offset is determined by the associated generator (a line, point, or arc). It's very easy to figure out the offset within one region: points and arcs have circular offsets, while lines have line offsets. The complete offset path is a result of connecting the offset from one region with the next region.