PCB Milling

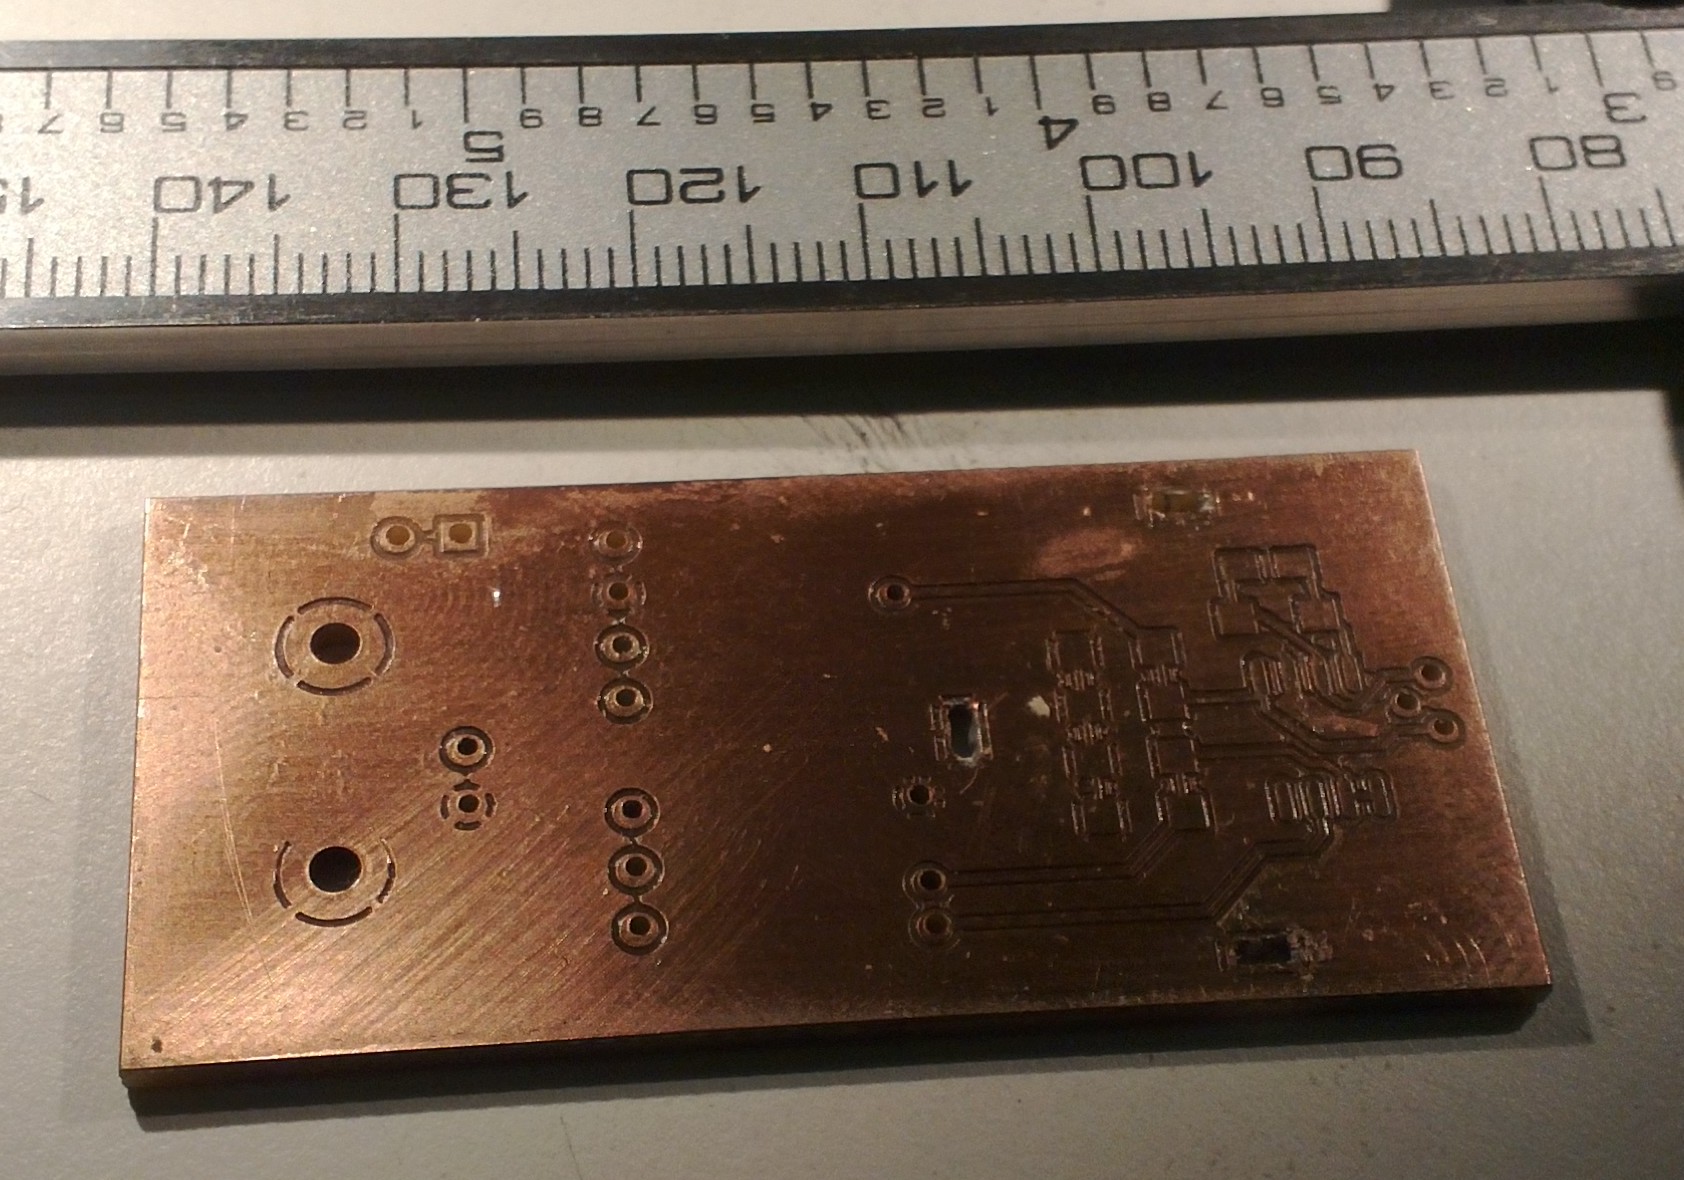
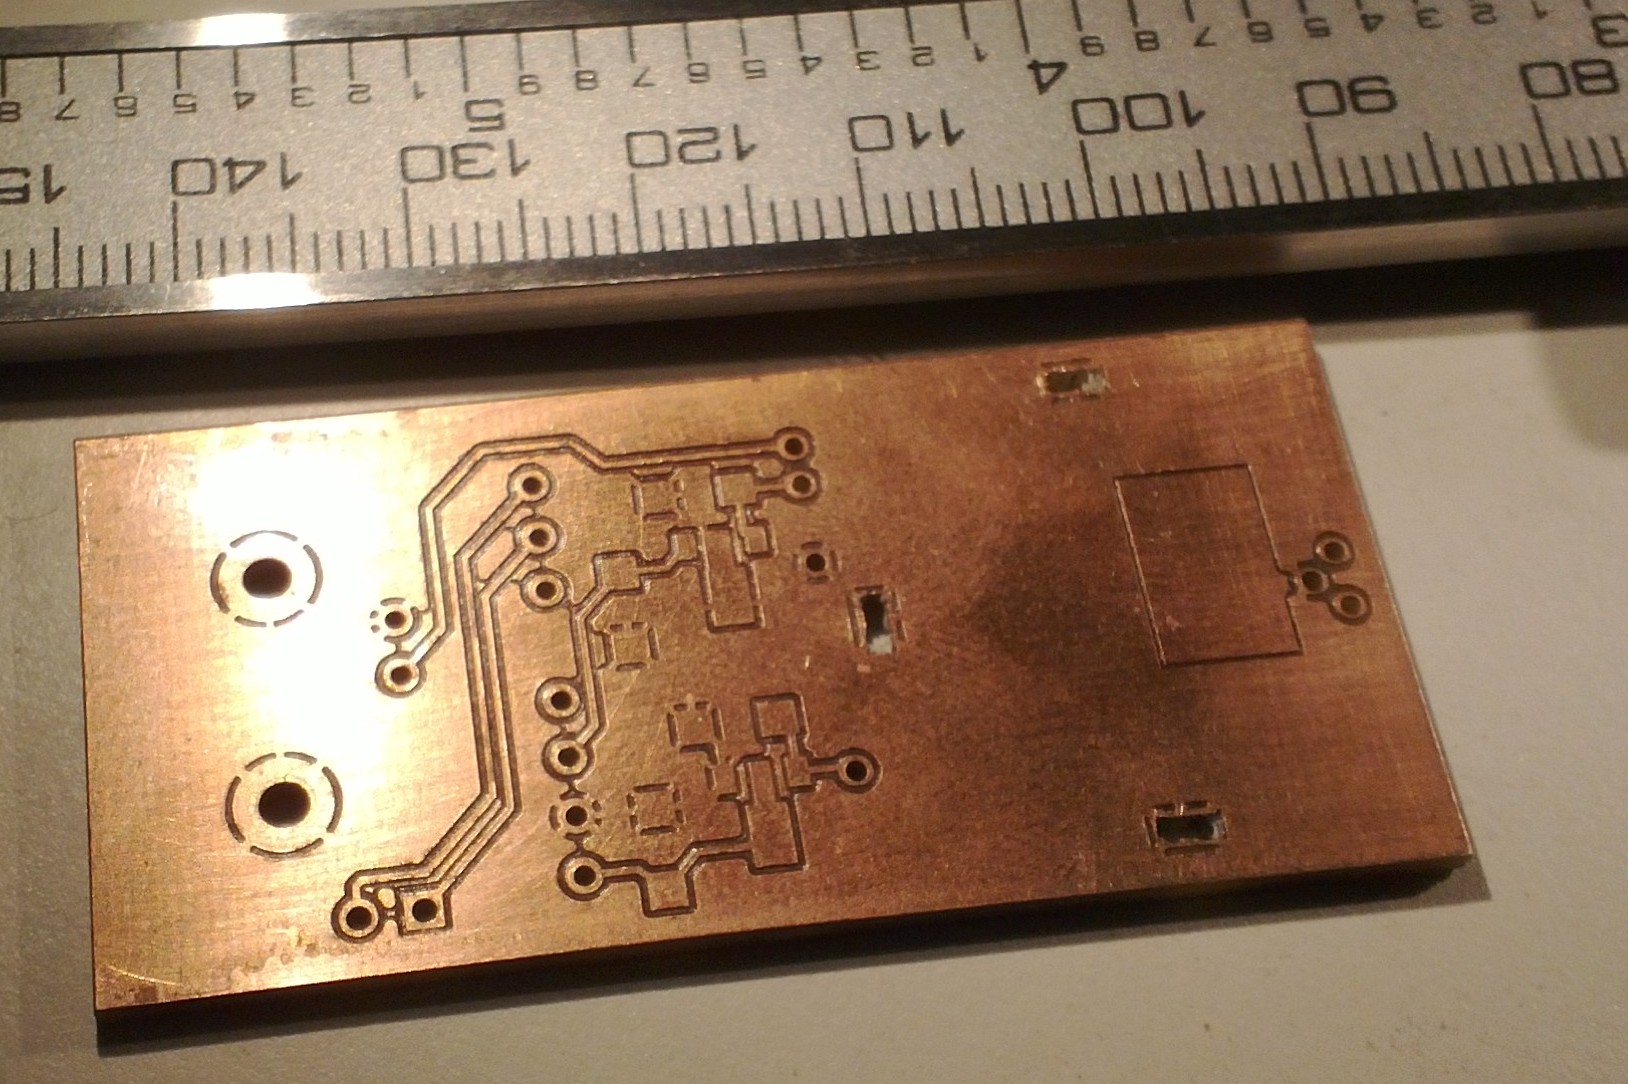
I'm making photodiode (transmipedance) amplifiers, and here is the first PCB being milled today. In the foreground a test-run where the cutter-height was too low resulting in too thin or vanishing PCB-traces. Note how the PCB material is not held in place along the Z-axis at all. The PCB-blank is just located in X/Y on the table using two locating pins/holes. In the Z-direction the idea is that the pneumatic cylinder pushes the lower flange of the spindle into contact with the PCB-material, and the exact cutter-height is adjusted relative to this flange only.

The toolchain is (old!) commercial software: PADS PowerLogic for schematic design, PADS PowerPCB for PCB-design, CircuitCam for converting the gerbers to HPGL, which BoardMaster uses to drive the mill (over RS232).

pd_amp_pcb_top pd_amp_pcb_bottom

For general purpose 3D CAD at work we have Vertex (a Finnish Inventor/SolidWorks clone) and I used it to draw a model of the amplifier:
pd_amp_assembly pd_amp_exploded

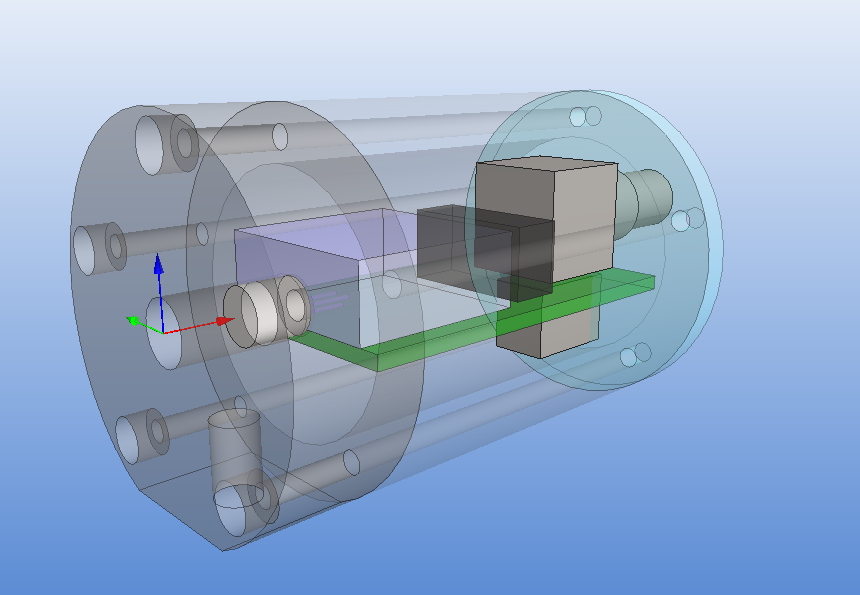
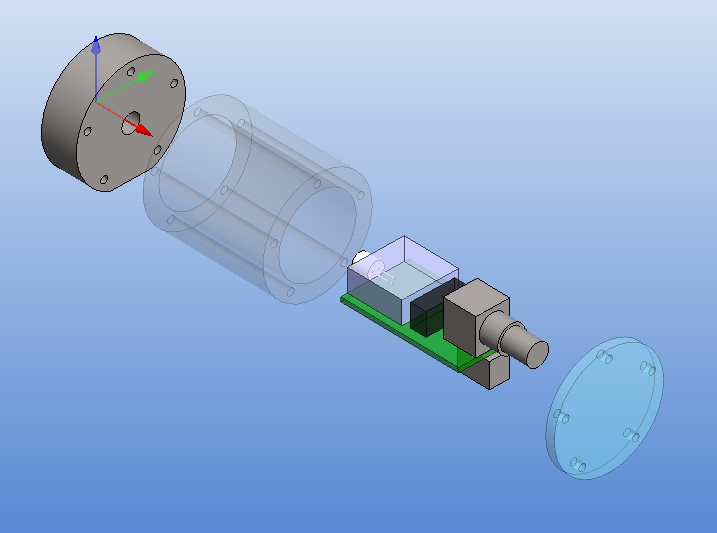
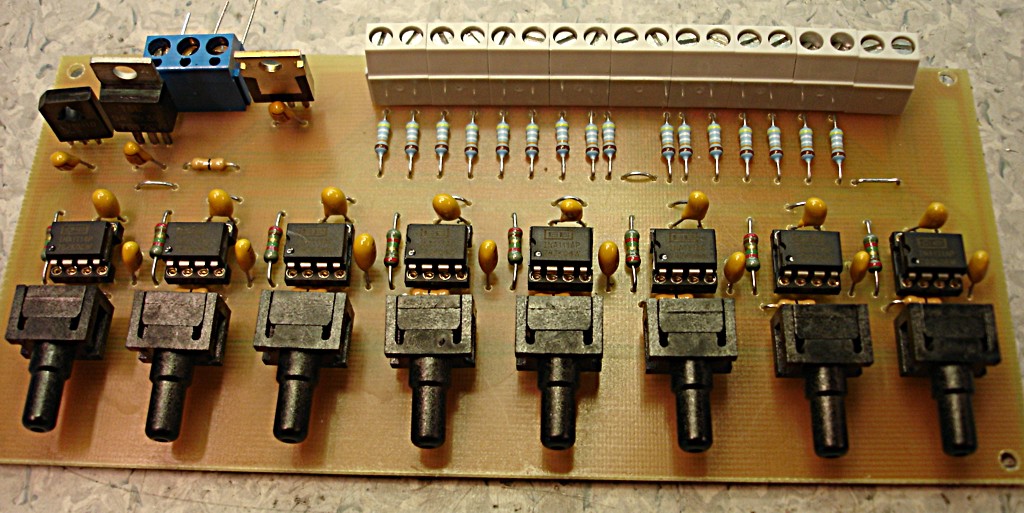
The size of the PCB and enclosure is mostly limited by how much of the powersupply one wants on-board, and how big connectors one wants to use. I'm using a standard BNC connector (SMA would have been smaller). The board is powered by a +9...18VDC supply which is DC2DC converted into +/-12 V and then regulated to +/- 5 V for the op-amp circuit. The box at the front is an RF shield for the amplifier itself. Light enters through an 8 mm hole in the face-plate and hits a TO-18 mounted photodiode. More on the circuit later.

The enclosure is 48 mm in diameter with a 16 mm thick face-plate, a 4 mm thick back-plate, and the body (55 mm length) bored out to an inner-diameter of 34 mm. The body should fit a 25x54mm PCB. The end-plates are attached to the body with five M3 screws on a 40 mm diameter bolt-circle. There is an M6 thread on the bottom of the face-plate, for attaching the amplifier to an optical-table or other instrumentation. I made two of these from 50 mm aluminium round-bar on a manual lathe and mill (using a rotary table for the holes/threads).

pd_amp_enclosure

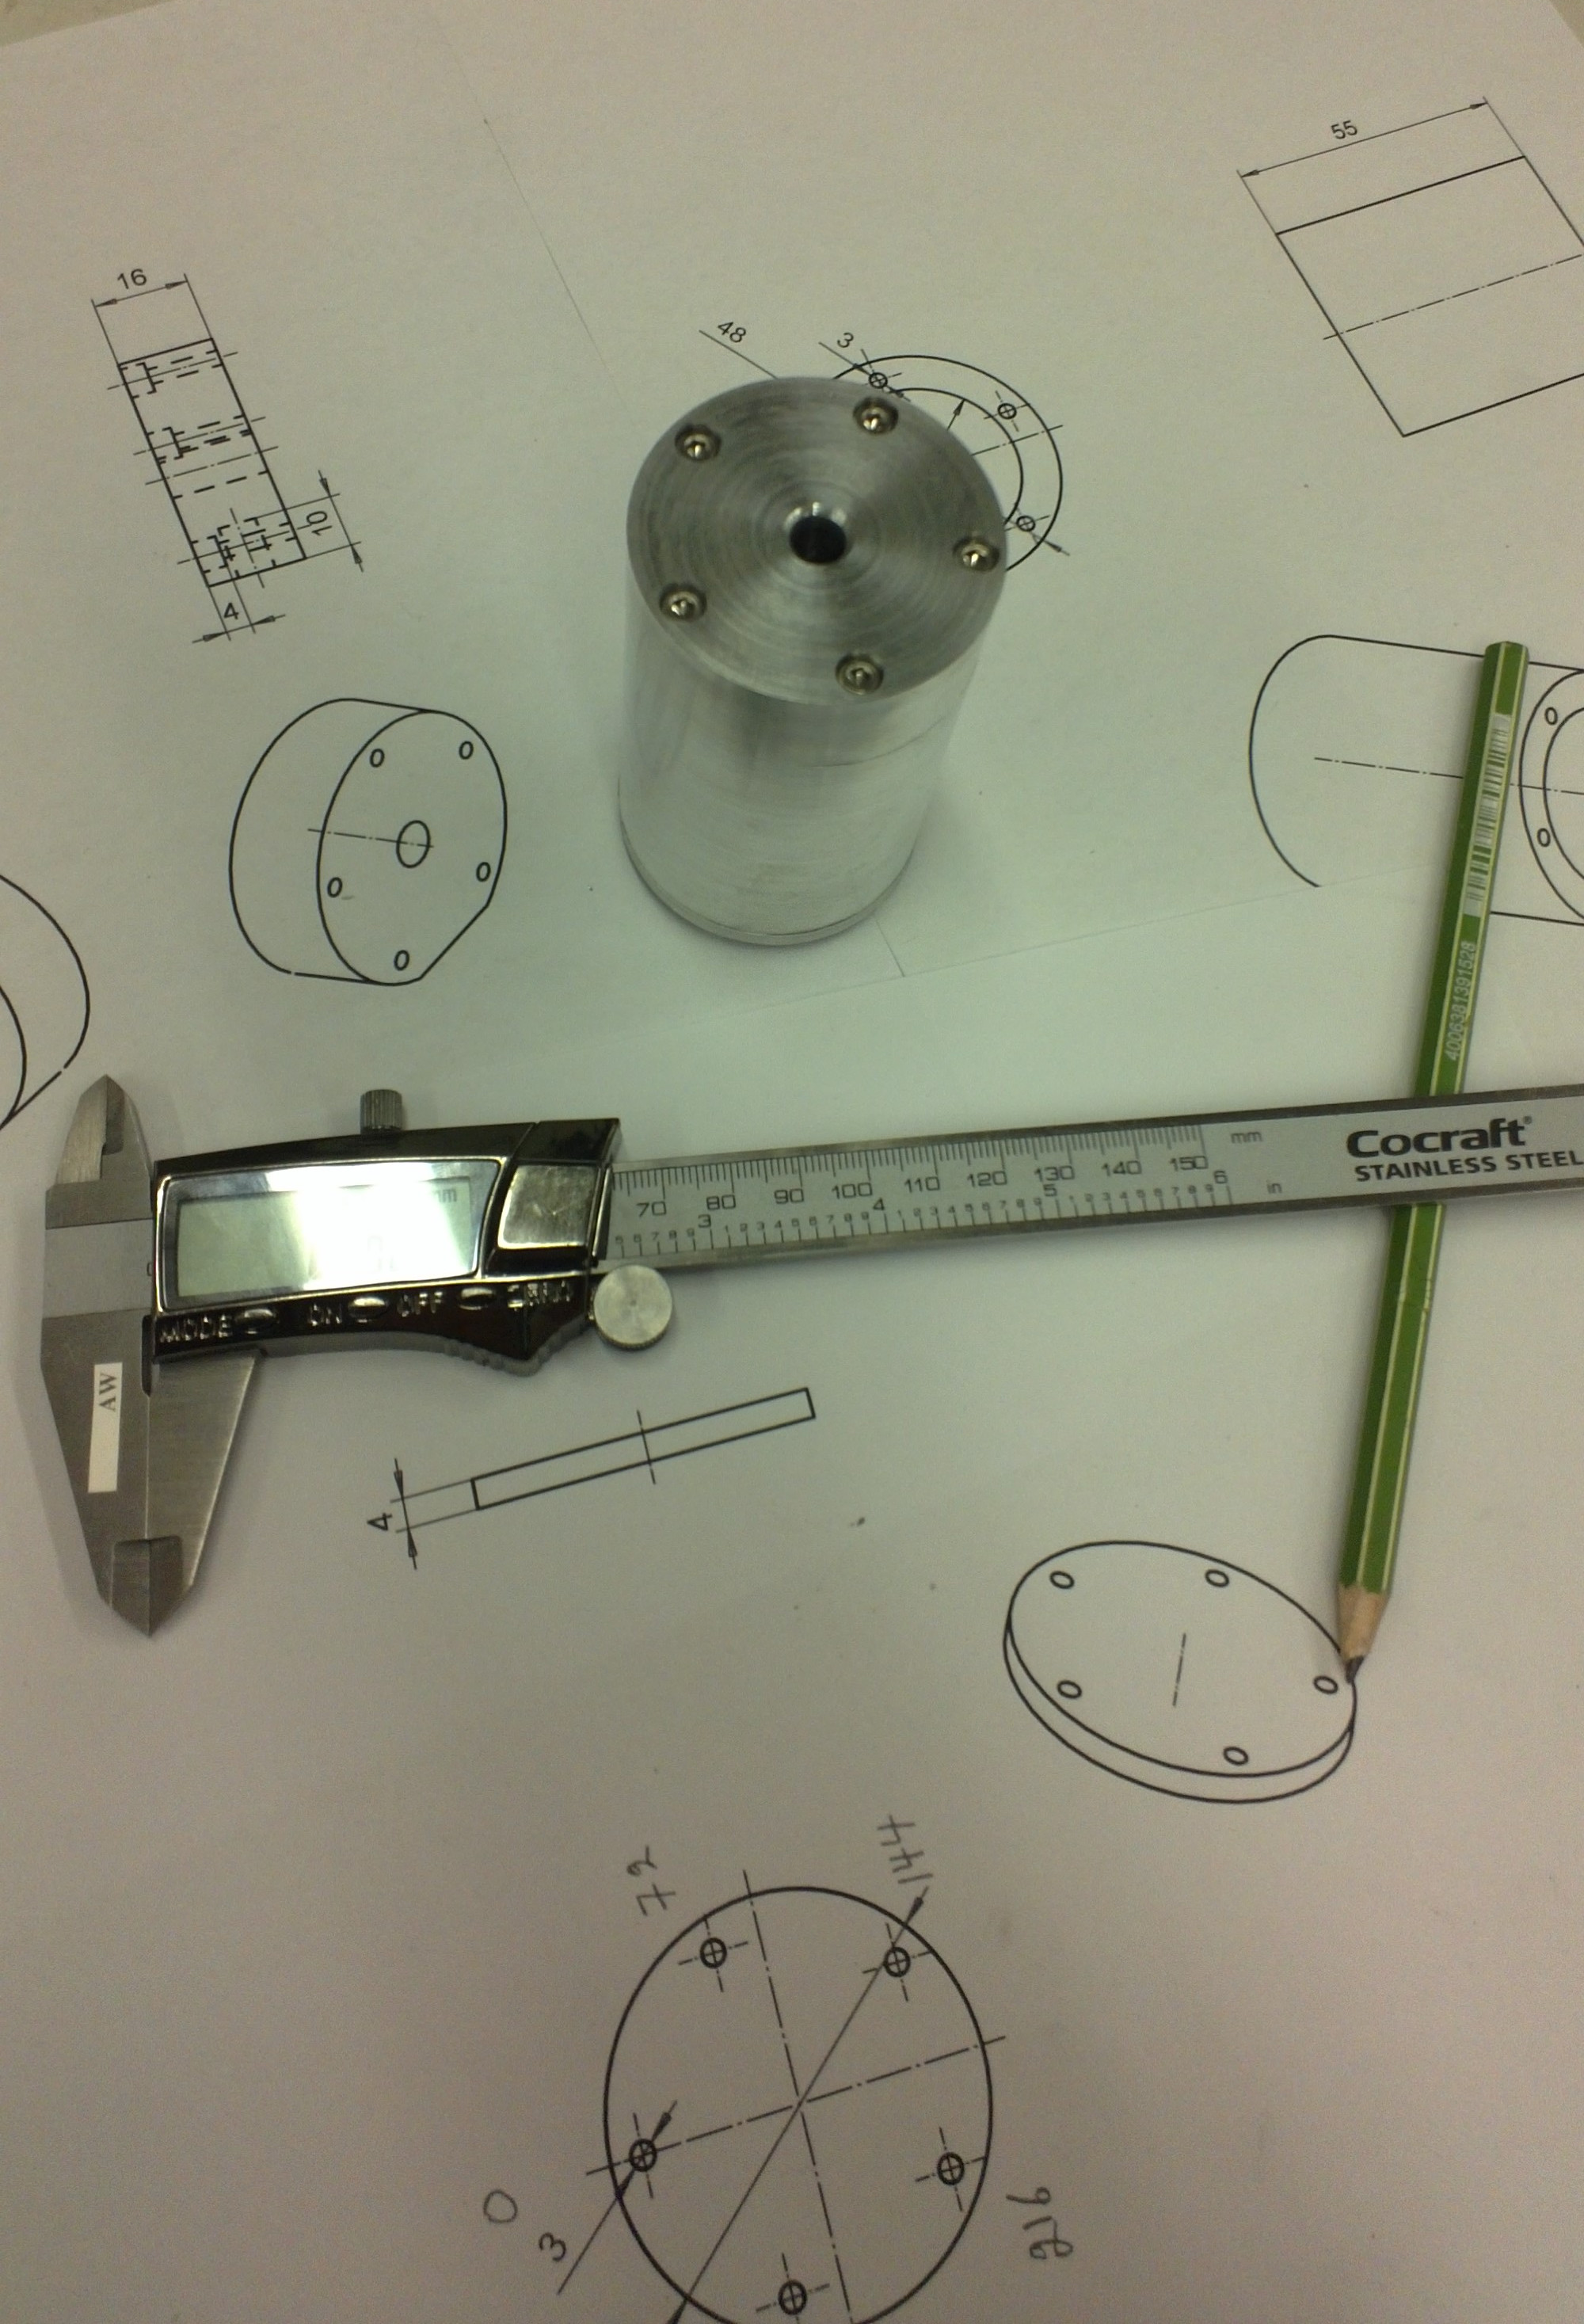
Note: for manual machining five evenly spaced holes the angle-sequence is: 0 - 72 - 144 - 216 - 288 - 0.

I'm thinking about polishing these a bit and then anodizing them. But for RF-shielding the contact-surfaces of all three parts would then have to be sanded/milled-down after andoizing. to ensure good electrical conductivity between the parts.

Lambda exonuclease video

The fourth paper from my thesis, entitled "Dual-trap optical tweezers with real-time force clamp control", has just been published online by Review of Scientific Instruments: http://link.aip.org/link/doi/10.1063/1.3615309

Here's a video from the paper. We are holding on to two micron sized plastic spheres with laser-beams (shown in the video as green/cyan cross-hairs). The lower beam/trap is stationary while the upper one is steerable. A ca 16um long DNA-molecule (invisible) is tethered between the beads.The experiment is performed in the presence of lambda exonuclease, an enzyme that "eats up" one strand of the DNA leaving just a single-stranded DNA-tether between the beads.

In the first part of the video a force-extension curve (bottom panel) is obtained using manual control. We stretch out the molecule by moving the upper trap upwards and check that the force-signal looks like it should when we have a single DNA-molecule of the right length between the beads.

In the second part, after t = 20 s, the tether is held force clamped at 3.4 pN (force shown in top panel). We're keeping the force constant with a PI-controller implemented on an FPGA that reads the force-signal from the lower bead and updates the position of the upper trap at around 200 kHz. As the molecule shortens the controller needs to move the upper trap/bead lower in order to maintain a 3.4 pN tension in the molecule. The video is at normal speed (1X) while the force extension curve is measured. During 13 min of force-clamp control the video is sped up 25-fold. During this time the exonuclease digests one strand of the double-stranded DNA molecule. When held at 3.4 pN of tension, single-stranded DNA is significantly shorter than double-stranded DNA. So the gradual conversion from a double-stranded tether to a single-stranded tether is seen as a decrease in the extension, i.e. a shortening of the distance between the plastic beads (middle panel). The tether broke at t = 880 s. Scale-bar 5 ?m.

Testing an optical force-clamp

Here a DNA-molecule is being stretched between two optically trapped polystyrene micron-sized beads. We're using an FPGA-based real-time controller for steering the upper trap. It's programmed with a PI-loop which aims to keep the force acting on the lower bead constant. Around 10s into the video we switch on the feedback-loop and we see the actual force on the bead rise to the set-point.

On SNR in single molecule experiments

ResearchBlogging.org

Wallin, A.E., Salmi, A., Tuma, R. (2007). Step Length Measurement--Theory and Simulation for Tethered Bead Constant-Force Single Molecule Assay. Biophysical Journal, 93(3), 795-805. DOI: 10.1529/biophysj.106.097915

A lot of single molecule experiments are carried out in the configuration shown above. The idea is to mechanically probe a bio-molecule (such as DNA or RNA) or find out how an enzyme (such as RNAP) or a molecular motor (e.g. viral packaging motor) works. You either optically or magnetically trap a microsphere (the round thing with diameter d), which allows you to move it around, measure its position very accurately, and measure the forces acting on the sphere. The sphere is a big thing, usually 500 to 1000 nm in diameter, so it's easily visible in the microscope (the molecules themselves are not visible unless you label them with fluorescent tags).

Then you ask a biochemist in your lab to bind some useful stuff to the sphere. I've illustrated a hypothetical experiment where a molecular motor (MM, grey blob) is bound to the sample chamber wall, and the bead is tethered to the motor via a Worm-Like Chain (WLC, thick wavy line, a common model for polymers such as DNA/RNA).

The problem is that these things are tiny! People want to measure single steps for molecular motors, which can be as short as 0.3 nm. At the same time biological things also live at close to room temperature, so both the molecules and the microsphere are affected by random collisions from the solvent molecules.

Now the question is how small steps or changes in the WLC length are really measurable? It's a bit like going on a walk with your dog: imagine a very flexible string between the dog and yourself. Now if you pull only weakly on the string you can't expect to feel very much of the individual steps the dog takes, you just follow along smoothly while keeping the force approximately constant. If you really want to feel the individual steps you would use a stiffer string and pull much harder on it(but the dog would not like that...). Previous work such as that by Gittes and Schmidt and Moffitt et al. pretty much agrees that the Signal-to-Noise-Ratio (SNR) should look something like this:

where you've used a force to stretch out the WLC (of length L) to an extension xe, the steps you are trying to detect are of size DeltaL, and the stiffness of the WLC is K. In the square root we have gamma (Stokes drag coefficient on the bead), Boltzmann's constant kb, temperature T, and f_lp the measurement bandwidth.

What do we need to do to get a high SNR (and thus measure short steps accurately) ? Use a large force (that increases xe and K), use small beads (that decreases gamma), cool down the lab (decrease T, but not so much so that your biology dies!), and measure slow moving stuff (low f_lp). But this formula is not so practical to use. You need to work out the extension xe yourself and also estimate the stiffness K somehow. I couldn't find anyone who had addressed how this works for common tethers such as DNA and RNA.

My (small) contribution to these thoughts is mainly working out how the SNR really depends on the properties of the WLC and the pulling force. I did a bit of simple theoretical analysis and showed with a Monte-Carlo simulation that the theoretical prediction is about right. This results in SNR 'maps' in parameter space that hopefully can guide experiments. For example if you suspect that your enzyme has a certain step length and you know your tether properties you can use the map or an approximate formula to work out the force you need to have a chance of measuring individual steps.