Frequency Distribution Amplifier 2017.01

1:8 frequency distribution amplifier based on LMH6702 and LMH6609 op-amps.

In particular the power-supply section using a common-mode choke, a Murata BNX025 filter, and low-noise regulators LT1963 and LT3015 seems to work quite well. I also used ferrites (2 kOhm @ 100 MHz) as well as an RC-filter on all supply pins. Perhaps overkill? Performance with the intended AC/DC brick is still to be verified.

Measurements around 10 MHz show a 1 dB compression at over 14 dBm and an IP3 of around 27 to 30 dBm. The gain extends beyond 100 MHz with some gain-peaking.

Some measurements of residual phase-noise with a 3120A phase-meter, at 10 MHz. My earlier distribution amplifier required shielding with aluminium foil as well as powering from a lead-acid battery to achieve a reasonably quiet phase-noise spectrum. These measurements were done with lab power-supplies for +/-12 V to the board and without any shielding.

Finally some measurements of gain vs. frequency with a Rigol spectrum analyzer.


Pulse Distribution Amplifier 2017.01

A new pulse distribution amplifier for 1PPS distribution.

The input is fed to a LT1711 comparator triggering at 1.0 V (set by reference ADR423). This edge is buffered by 74AC14 before 1:8 fan-out to output-stages with three 74AC04 inverters in parallel driving the outputs.

Preliminary measurements show around 200ps channel-to-channel propagation skew - to be improved on by further trace-length matching or tuning. More measurements to follow.

Distribution Amplifier 2017.01

A new distribution amplifier design featuring a 1PPS pulse distribution amplifier (PDA) and a 5/10 MHz frequency distribution amplifier (FDA).

1U 150mm deep rack-enclosure from Schaeffer. Prototype PCBs without soldermask or silkscreen from Prinel. Both the FDA and PDA boards have 1:8 fan-out with 9 BNC (optionally SMA) connectors spaced 16mm apart. The boards fit comfortably side-by side on a 19" rack panel. Some funky BNC-cables with unusually large connectors may not fit side-by-side 16mm apart - a price to pay for the compact design. The plan is to use an +/-12 AC/DC brick power-supply (not shown) which fits in the back of the enclosure.

Detailed posts on the PDA and FDA boards to follow.

AllanTools 2016.11 - now with Confidence Intervals!

at2016-11_wtih_ci

I've added confidence interval estimation to allantools, based on a 2004 paper by Greenhall & Riley: "Uncertainty of stability variances based on finite differences"

So far not much is automated so you have to run everything manually. After a normal call to allantools.adev() to calculate the ADEV we loop through each (tau, adev) pair and first call allantools.edf_greenhall() to get the number of equivalent-degrees-of-freedom (EDF), and then evaluate a confidence interval with allantools.confidence_interval(). A knowledge or estimate of the noise type "alpha" is required for edf_greenhall() - here we just assume alpha=0.

This example is on github at: https://github.com/aewallin/allantools/blob/master/examples/ci_demo.py

import numpy
import matplotlib.pyplot as plt
 
import allantools as at
 
# this demonstrates how to calculate confidence intervals for ADEV
# using the algorithms from Greenhall2004
data_file = '../tests/phasedat/PHASE.DAT'
 
def read_datafile(filename):
    p = []
    with open(filename) as f:
        for line in f:
            if not line.startswith("#"):  # skip comments
                p.append(float(line))
    return p
 
# read input data from file
phase = read_datafile(data_file)
# normal ADEV computation, giving naive 1/sqrt(N) errors
(taus,devs,errs,ns) = at.adev(phase, taus='octave')
 
# Confidence-intervals for each (tau,adev) pair separately.
cis=[]
for (t,dev) in zip(taus,devs):
    # Greenhalls EDF (Equivalent Degrees of Freedom)
    # alpha     +2,...,-4   noise type, either estimated or known
    # d         1 first-difference variance, 2 allan variance, 3 hadamard variance
    #           we require: alpha+2*d >1     (is this ever false?)
    # m         tau/tau0 averaging factor
    # N         number of phase observations
    edf = at.edf_greenhall( alpha=0, d=2, m=t, N=len(phase), overlapping = False, modified=False )
    # with the known EDF we get CIs 
    # for 1-sigma confidence we set
    # ci = scipy.special.erf(1/math.sqrt(2)) = 0.68268949213708585
    (lo,hi) = at.confidence_intervals( dev=dev, ci=0.68268949213708585, edf=edf )
    cis.append( (lo,hi) )
 
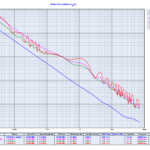
# now we are ready to print and plot the results
print "Tau\tmin Dev\t\tDev\t\tMax Dev"
for (tau,dev,ci) in zip(taus,devs,cis):
    print "%d\t%f\t%f\t%f" % (tau, ci[0], dev, ci[1] )
""" output is
Tau	min Dev		Dev		Max Dev
1	0.285114	0.292232	0.299910
2	0.197831	0.205102	0.213237
4	0.141970	0.149427	0.158198
8	0.102541	0.110135	0.119711
16	0.056510	0.062381	0.070569
32	0.049153	0.056233	0.067632
64	0.027109	0.032550	0.043536
128	0.026481	0.033855	0.055737
256	0.007838	0.010799	0.031075
"""
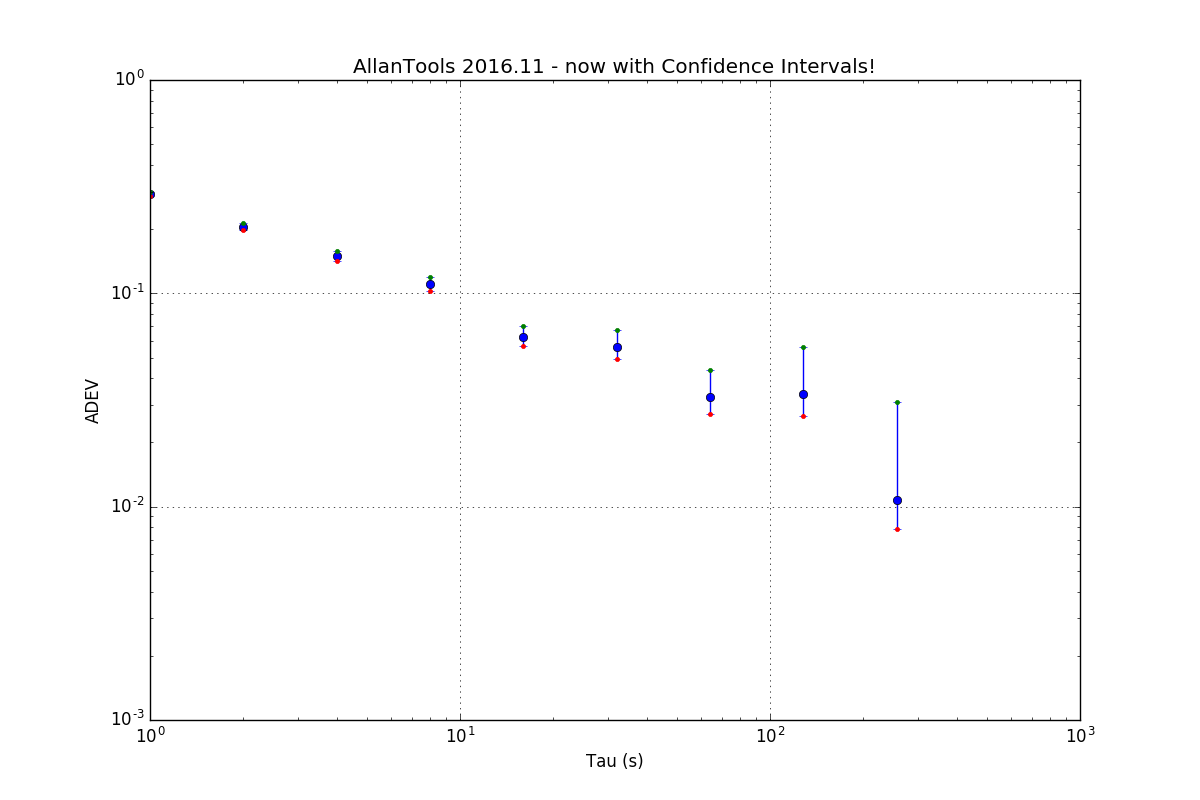
plt.figure(figsize=(12,8))
plt.gca().set_yscale('log')
plt.gca().set_xscale('log')
err_lo = [ d-ci[0] for (d,ci) in zip(devs,cis)]
err_hi = [ ci[1]-d for (d,ci) in zip(devs,cis)]
 
plt.errorbar(taus, devs, yerr=[ err_lo, err_hi ] ,fmt='o')
plt.grid()
plt.xlabel('Tau (s)')
plt.ylabel('ADEV')
plt.title('AllanTools 2016.11 - now with Confidence Intervals!')
# just to check plot the intervals as dots also
plt.plot(taus, [ci[0] for ci in cis],'r.')
plt.plot(taus, [ci[1] for ci in cis],'g.')
 
plt.show()

Ettus OctoClock distribution amplifier

I measured the phase-noise of an Ettus OctoClock distribution amplifier. These plots compare it to earlier measurements on an SRS FS710 and a Symmetricom 6502 as well as my own TADD-1 inspired AD8055 prototype.

OctoClock schematic here: http://files.ettus.com/schematics/octoclock/octoclock.pdf

10 MHz clock-distribution chip: http://www.ti.com/lit/ds/symlink/cdce18005.pdf

For time-nuts kind of stuff (H-masers!) the 10 MHz phase-noise doesn't look that great, and there is something funky going on in the AM noise!? The box is powered by a +6 VDC wall-wart PSU which is probably the cause of all those spikes...

The PPS-channels are based on 7404 hex-inverters and look OK. 200ps of skew is equivalent to 4 cm of trace-length (?) - which seems like a lot if there was an effort to minimize it... For a 1 V/ns rise-time pulse 200ps is equivalent to 200mV of DC-offset in either the signal or the counter trigger-level which also seems like a lot?

PICDIV frequency divider

I put together a PICDIV frequency divider for use with a Rubidium clock.

I used an LTC6957-3 to convert the 10 MHz sine-wave from the clock to a CMOS logic signal (square wave). The LTC6957-3 has two outputs, one is routed to a BNC connector output, the other is used as the clock for a PIC12F675. The PIC runs pd09.asm which outputs a 20 us long pulse every second - i.e. it divides the 10 MHz input frequency by 1e7. The PIC is programmed through a 5-pin 100 mil ICSP header.

Here are some test-signals with a SRS PRS-10 as the source, and recorded on a Rigol scope.

The outputs behave as expected, but the 1PPS from the PIC is only 700 mVpp into 50R - a bit low. When terminated to 1 MOhm the rise-time is much worse so this is best avoided. Perhaps a buffer or level-translator would be a good addition.

Finally phase-noise measurements on the 10 MHz CMOS output, performed with a 3120A phase-noise probe.

I tried shielding the circuit with aluminium foil and powering it from a +12 VDC lead-acid battery - however the three measurement runs look roughly similar. Perhaps the LM317 regulator is not a great choice here, and both the LTC sine-to-square chip and the PIC should have more bypass caps and decoupling (inductors, ferrites?). In any case the phase-noise is 10-20x better than the measurement noise from a typical counter (SR620 or 53230A), so any issues only show up with high-end phase-noise probes.