Learning about WR absolute calibration at NIKHEF, Amsterdam.
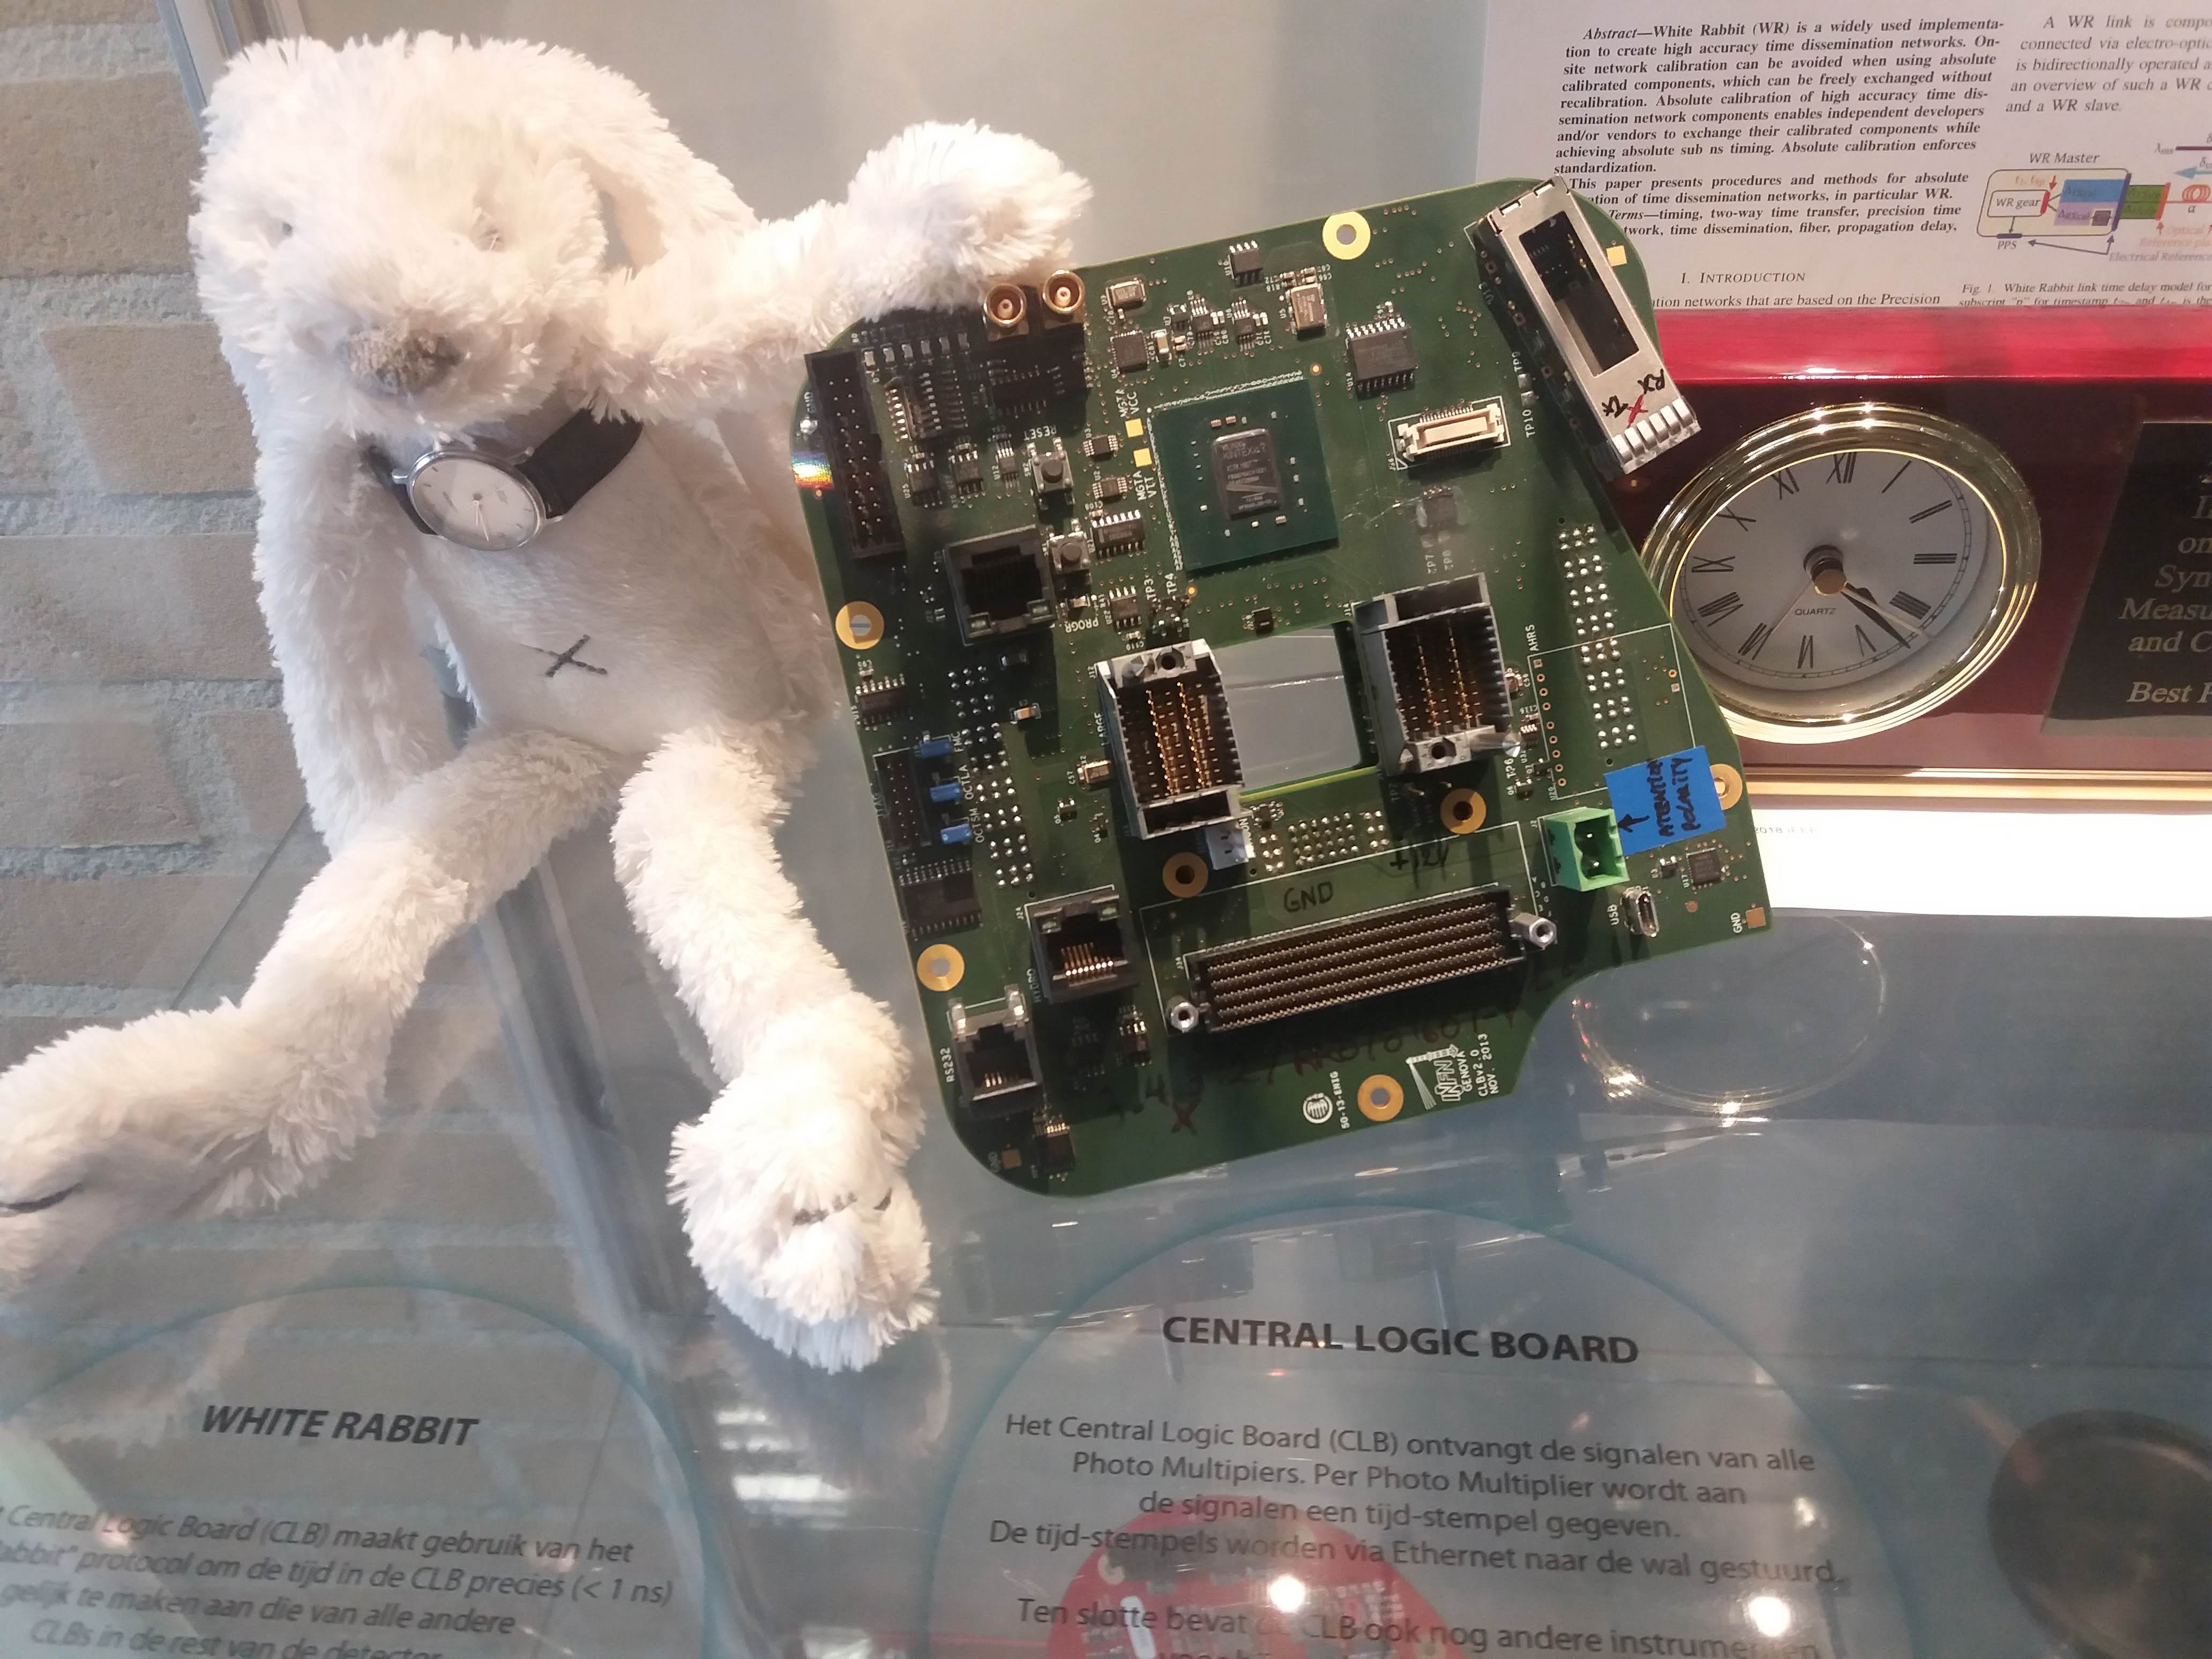
Learning about WR absolute calibration at NIKHEF, Amsterdam.
Possibly the longest White Rabbit link in operation currently. More info in our paper: "White Rabbit Precision Time Protocol on Long Distance Fiber Links" http://dx.doi.org/10.1109/TUFFC.2016.2518122

I gave a talk at the White Rabbit Workshop in Amsterdam about our long link, ideas for fiber asymmetry calibration, and recent stability measurements. The slides are online.
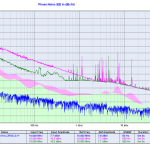
I updated my earlier picture with the noise-floor of three different phase-noise measurement setups. The picture now includes a typical good OCXO trace and the CLK2 10MHz output of a GM-locked White Rabbit Switch (v4.2 firmware).
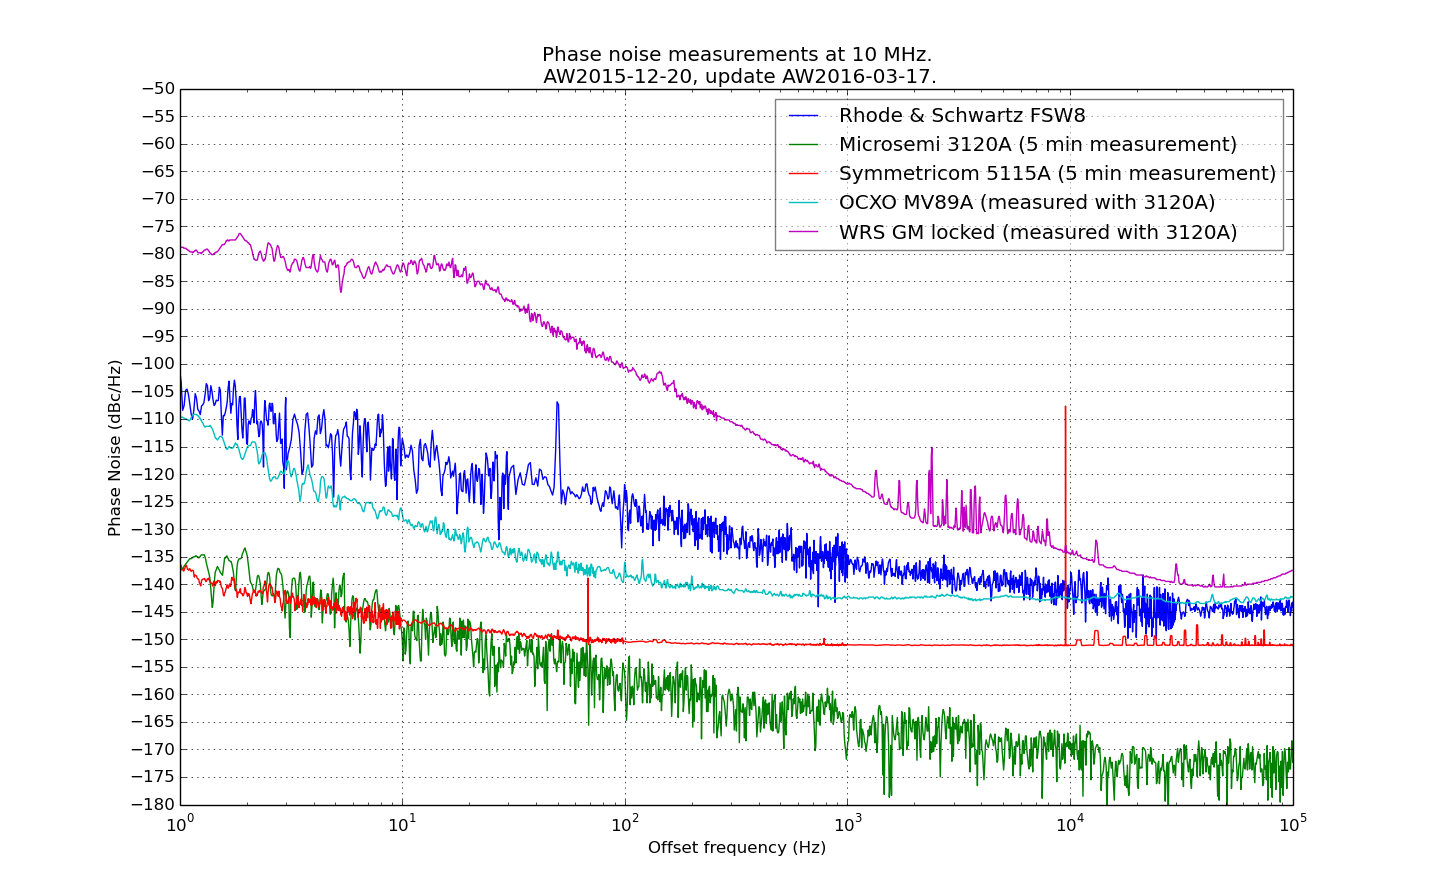
I measured the CLK2 10 MHz RF-output of two White Rabbit switches with a Microsemi 3120A. The results are similar to previous results with ADEV(1s)=1.5e-11.
When phase-locked to an external reference clock the long-term stability is obviously much better than when free-running, but for small tau, or high offset-frequency in the phase noise plot, the free running oscillator is actually better.
We got some White Rabbit Switches and I did an initial test of the pulse-per-second (PPS) output stability. In contrast to earlier measurements that showed 200ps or so of white phase noise, the PPS output on the WRS now seems a lot more stable. For various reasons the noise-floor (red data) of our 53230A time-interval-counter is at around 50e-12 @ 1s, and the WRS PPS output is at very much the same level of stability. Another 53230A counter shows about 13 ps standard-deviation for a cable-delay measurement - so I may redo these measurements with that counter. In any case a real evaluation of the short-term stability requires a DMTD measurement at 10 MHz.
Further testing of the time-stamping hardware. The idea was to generate a weak beam of light with an intensity modulation at 1-12 MHz, count and time-stamp the photons, and see if the modulation can be measured with a correlation histogram.
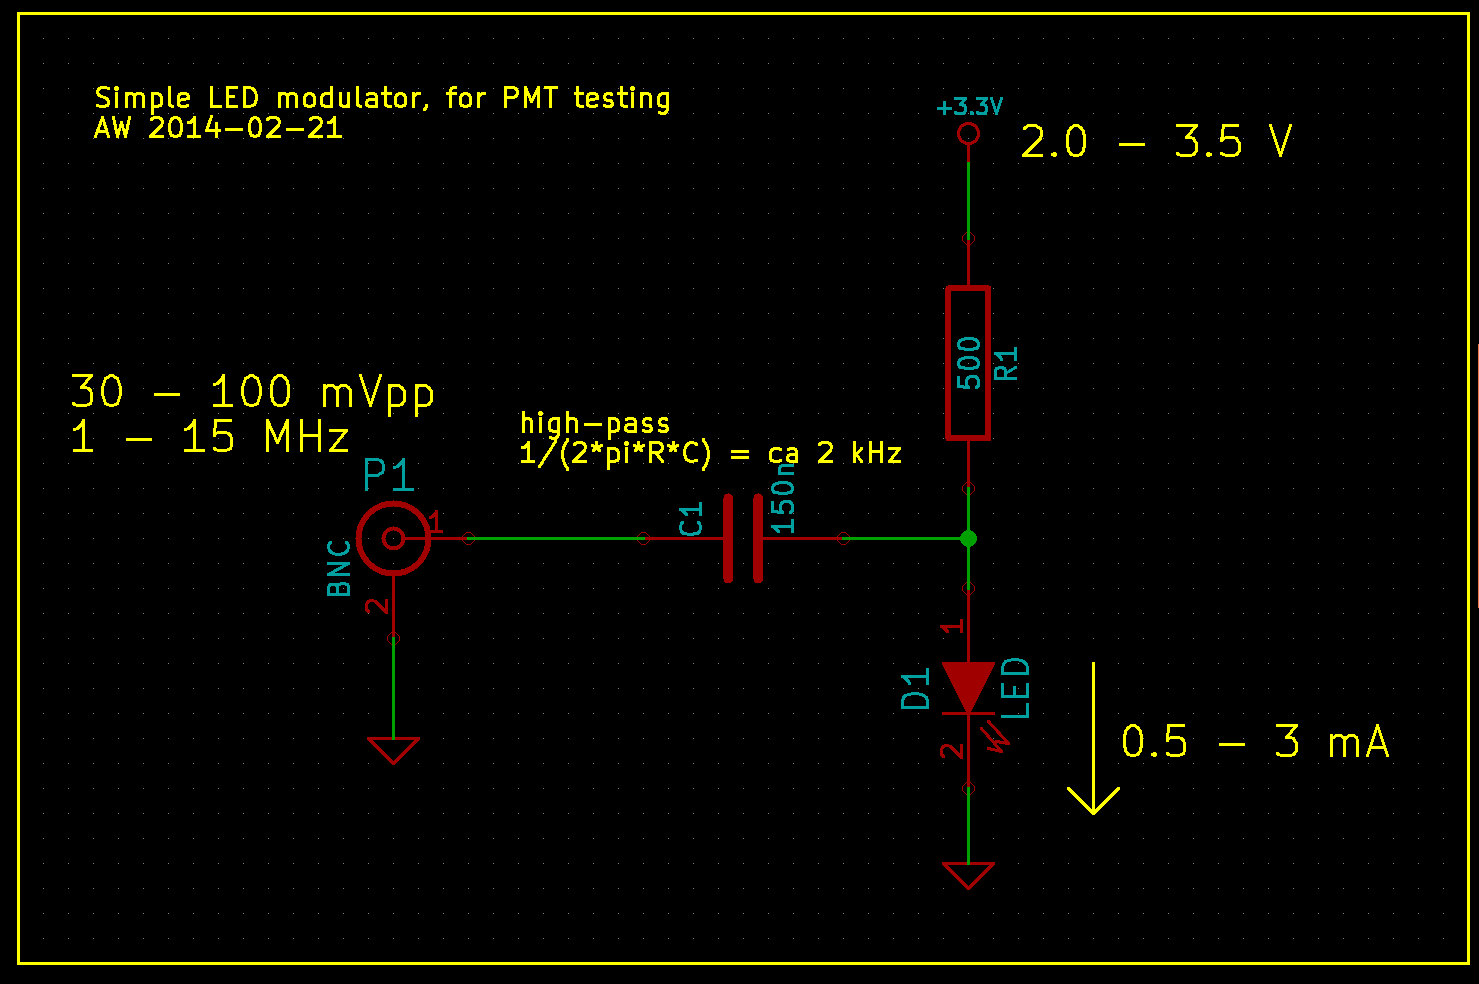
To generate a stream of photons intensity modulated at a frequency f_mod I used this simple LED circuit driven by an adjustable DC power-supply and a signal generator. I didn't test the bandwidth of the circuit and LED, but it seems to work well for this test at least up to 12 MHz.
If we are given such a stream of photons, with an average rate of say 10 kphotons/s, how do we detect that the modulation at MHz frequencies is there? Note that the average rate of photons is much much smaller than the modulation frequency. If we receive photons at 10 kcounts/s there is on average 1000 cycles of modulation between each photon-event, when f_mod=10 MHz.
One way is to count the photons with a photon-counter, and time-stamp each photon. We should now on average see more/less photons every 1/f_mod seconds. So if we histogram all time stamps modulo 1/f_mod, we should get a sine-shaped histogram. This assumes that the signal generator creating f_mod and our time-stamping hardware share a common time-base.
This works quite nicely!
At the start of the video we see only the dark counts of the PMT. A DC voltage is then applied to the LED and the histogram rises up, but remains flat. When the modulation is applied we immediately see a sine-shape of the histogram. If we adjust the the frequency, phase, or amplitude of the modulation we see a corresponding change in the histogram.
The video first has testing at f_mod=1 MHz, with a histogram modulo 1/f_mod = 1000 ns, and later with f_mod=12 MHz and the histogram modulo 83333 ps. The later part of the video also has a least-squares sin() fit to the data.
This technique is very sensitive to mismatch between the applied frequency f_mod, and the histogram mod-time 1/f_mod. I first wanted to try this at 12 MHz, so I set the histogram mod-time to 83333 ps - and saw no sine-histogram at all! This was because I had rounded 1/f_mod to the nearest picosecond, and 1/83333 ps is actually 12 000 048 Hz - not 12 MHz!
At 12 MHz a deviation of 48 Hz is a few ppm in fractional frequency, and I later tested that changing f_mod by a fraction of ca 1e-8 makes the histogram slowly wander to the left or right. Any larger deviation and the correlation is lost.
All of this is similar to a lock-in technique, so the same principles should apply.
I'm testing the White Rabbit Fine-Delay FMC. It has an ACAM TDC-GXP time-to-digital converter that time-stamps the leading edge of an input trigger signal with ~30 ps resolution.
Recent work by Alessandro Rubini introduced a raw_tdc=1 driver mode which on my computer is able to collect time-stamps at a maximum rate of ca 150 kHz. Each time-stamp is 24-bytes, so this corresponds to a data-stream of roughly 4 Mb/s.
The video shows two graphs that update in real-time on the machine that collects time-stamps. The first is simply a (reciprocal) frequency counter where we count how many time-stamps arrive within a certain gate/window.
The second part of the video shows a modulo(tau) histogram where we bin time-stamps modulo tau into a histogram. The histogram was calculated for tau=100 us and an input frequency of 1 kHz was used. This results in the central peak in the histogram. I then slightly increased the frequency to 1.000010 kHz which makes the peak wander to the right. The peak on the right was produced by again tuning the input frequency to exactly 1 kHz. Similarly a lower input frequency of 999.970 Hz makes the peak wander to the left, and the peak around 20us was produced after tuning back to 1 kHz.
This hardware/software combination will be useful for collecting statistics and correlations in any experiments where a pulse type detector is used to measure something - provided the pulse-rate is below 150 kHz or so.
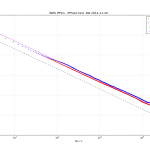
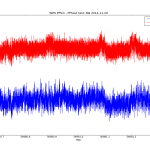
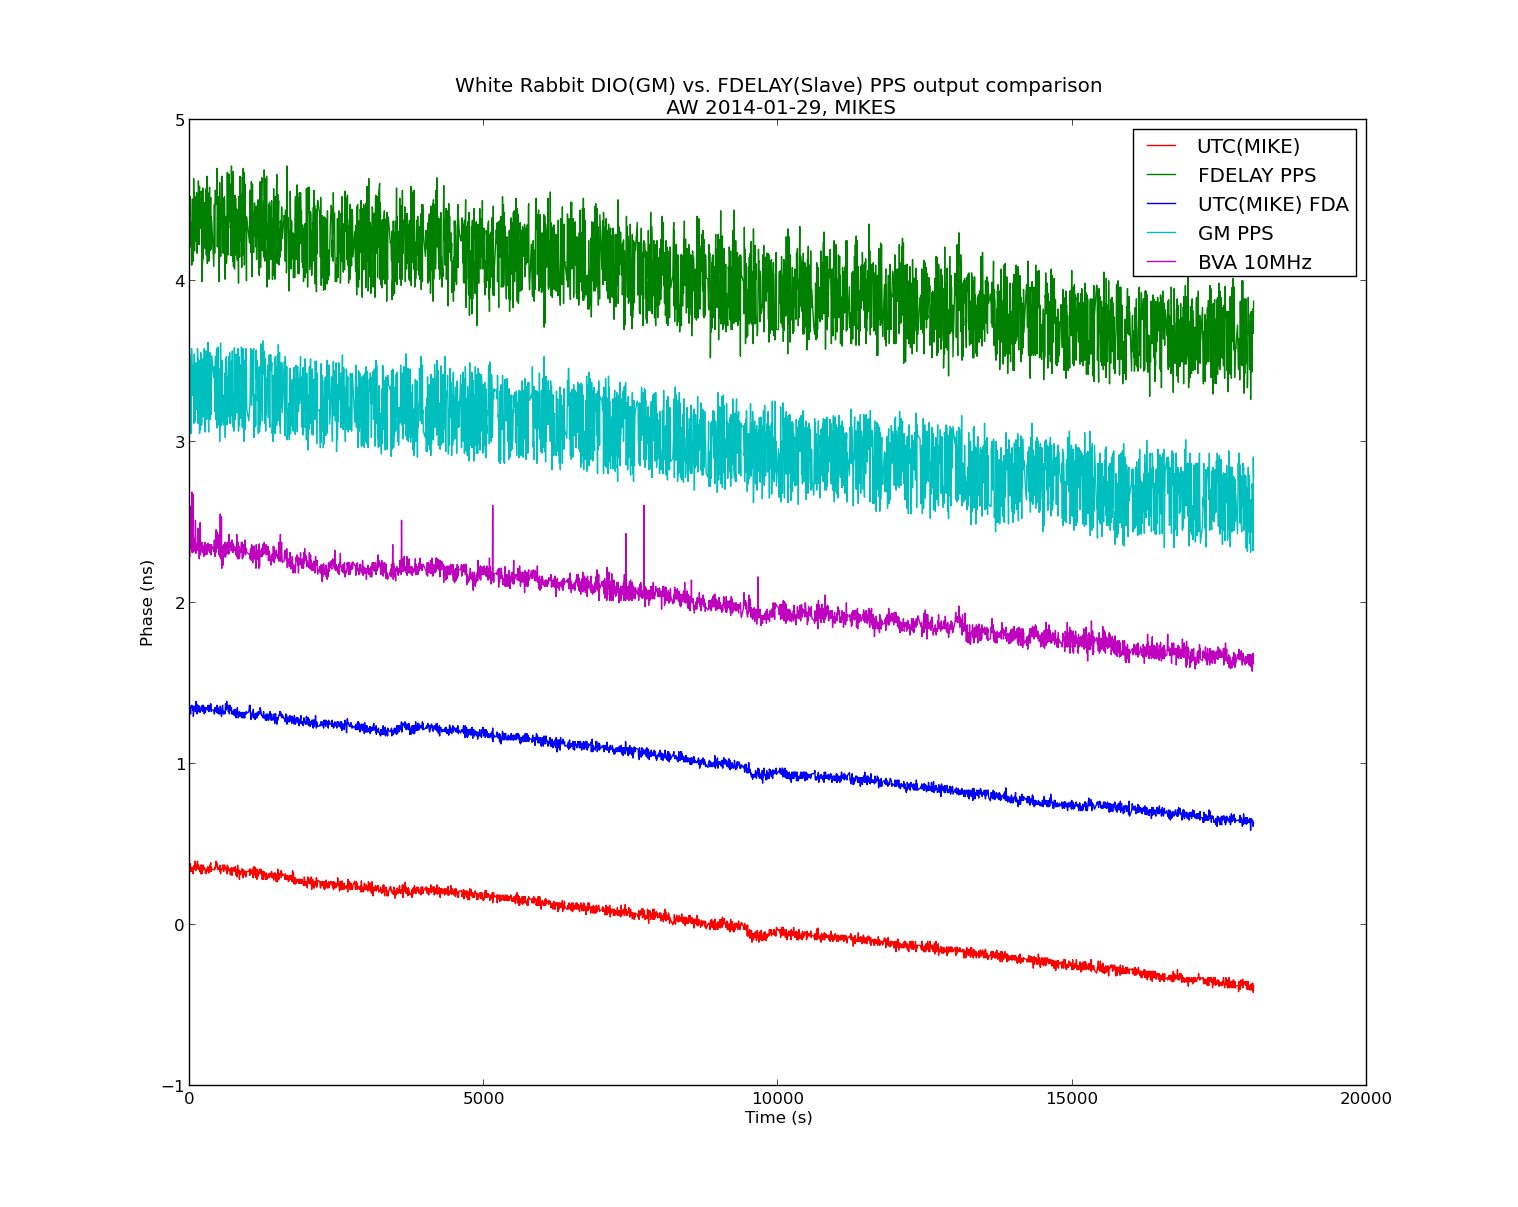
I ran a test to compare the quality of PPS outputs from a DIO (used as GM) and an FDELAY (used as slave) White Rabbit SPEC/FMC combinations. Here is the phase data measured with a Time-interval-counter. The nice clean traces are derived from a H-maser. We then lock a BVA (internally 2x multiplied to 10MHz) to this PPS signal. The GM node is locked to this 10MHz signal.
The average of each trace was removed, and the traces are offset for clarity.
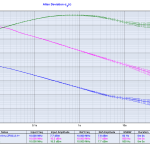
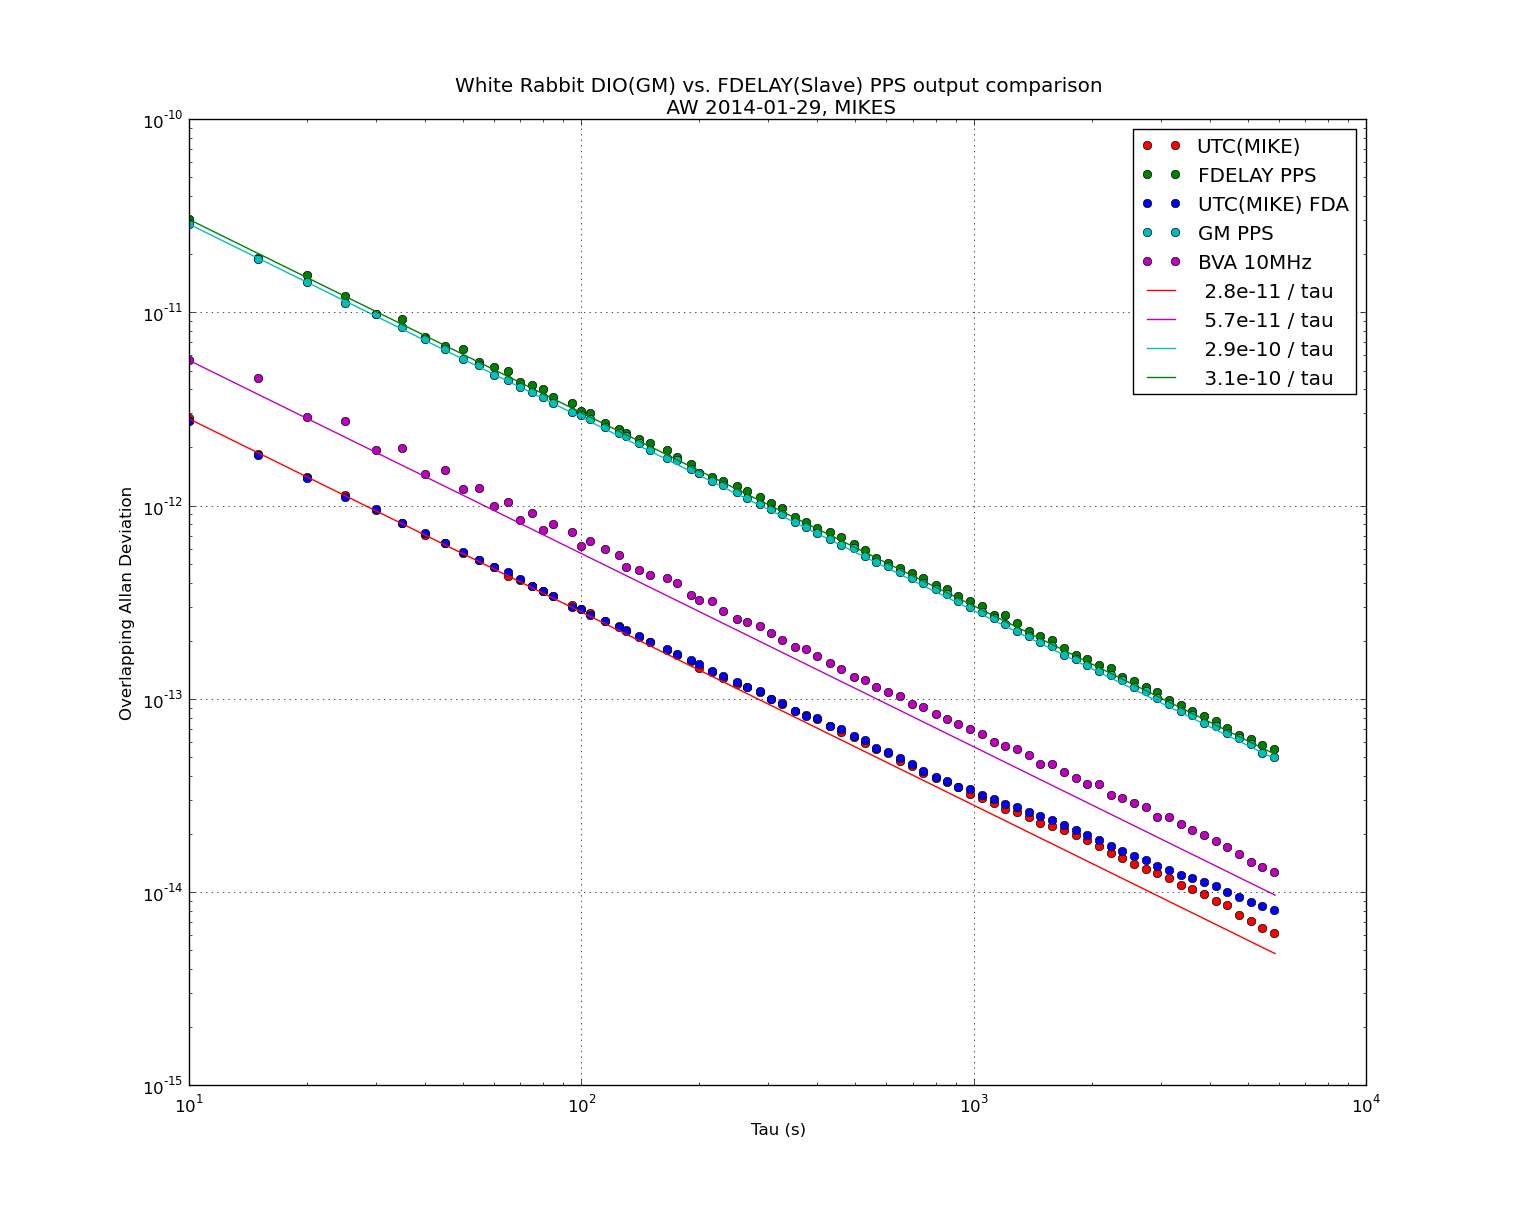
The Allan deviations look like this. Both the DIO and FDELAY PPS outputs have allan deviations about 5x worse than the BVA used as input clock for the GM.
I've been playing with White Rabbit hardware at work. White Rabbit uses a combination of SyncE and PTP to perform very precise (<1 ns) time-distribution.
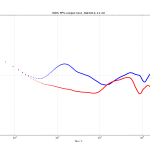
The standard low-precision way to distribute time is NTP. I hacked together a very experimental "Type 28" NTP refclock driver that reads the WR-time from SPEC shared memory and writes it to another location in shared memory where NTP expects it. Code over here: https://github.com/aewallin/ptp2ntpd
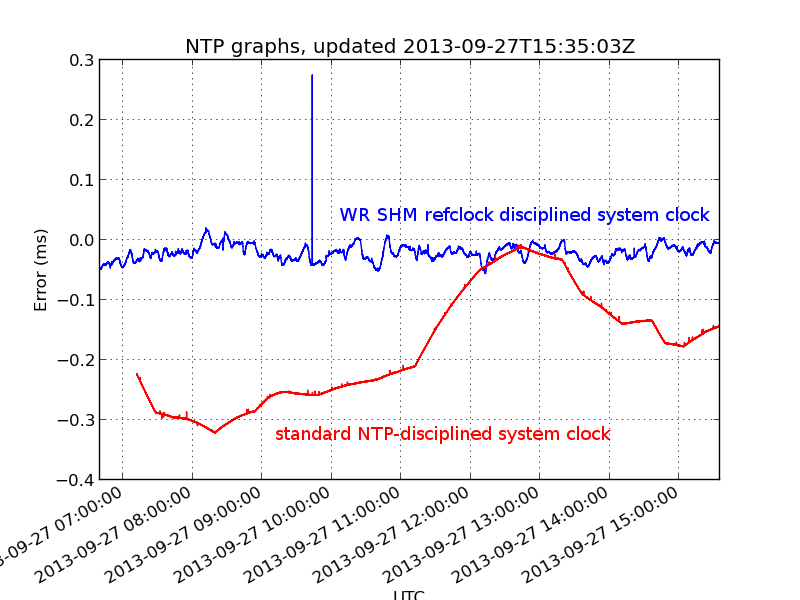
The graph shows system clock variations compared to WR-time (which we assume is very accurate) for a computer with the WR-refclock driver enabled (blue trace, minpoll 16 s), and another computer where the system clock is kept on time using standard NTP (I just added some servers to ntpd.conf, no other settings changed from default Ubuntu 12.04LTS). The WR-disciplined clock stays within maybe 50 microseconds with no net drift during the ~9 hour measurement, but the trace is quite jumpy. The NTP-disciplined clock wanders around much more (300 us) but the trace is smoother.