Non-smooth output from ttt

I tried cranking up (10-fold) the number of line-segments that are used when approximating conics and cubics with lines. The results are mostly OK, but sometimes "wiggles" or "S-curves" appear, which cause problems for the medial-axis filter. This "P" is an example:

The medial axis on the right does not look correct. If we zoom in it's clear that there's an "S-curve" in the input geometry, which causes a LINELINE edge (drawn in darker blue), which the medial-axis filter doesn't think should be removed:

For the letters "EMC" it looks mostly OK, but there's a similar wiggle in "E"


Increasing the number of line-segments further causes even stranger things. Here's a zoom-in at the top of "P" that shows both the wiggle that was visible before, but also a strange inward bulge:

Hopefully this is a bug in how conics/cubics are converted to line-segments in ttt, and not an issue with how FreeType fonts are represented.

EMC2 Filters

I hacked together a few python-scripts that can be run as "filters" in EMC2. They are opened/run from AXIS and produce G-code into EMC2.

The first one is ttt2ngc which simply demonstrates my C++ port of Chris Radek's truetype-tracer. The original code is a rather monolithic C-program while my C++ port is divided into smaller files and offers python-bindings and more options (for example arc, cubic, conic output can be turned on/off independently).

The seconds script is ttt2offset which takes ttt-geometry, builds a VD, and produces offsets. By reversing the list of points from ttt either inwards or outwards offsets can be produced. Currently the toolpaths are machined in the order they are produced, i.e. in order of increasing offset value. An improvement would be to order the loops so that for e.g. pocketing the innermost loop is machined first, and rapid-traverses are minimized.


The third script is ttt2medial. Here the VD is filtered down to an (approximate) medial-axis, and the edges of the medial axis are chained together into a toolpath. The chaining-algorithm could probably be improved much, again to minimize rapid-traverses.

If this is run with a V-shaped cutter with a 90-degree angle we can push the cutter into the material by an amount equal to the clearance-disk radius of the edge. This is a "V-carving" toolpath which should produce a cut-out very similar to the outline of the font. For added effect choose a material with  contrasting surface and interior colors.

It would be interesting to know if this v-carving g-code is anywhere near to correct. If someone has a cutting-simulator, or is adventurous enough to run this on an actual machine, I'd be very interested in the results! (here is the g-code: emc2_vcarve.ngc)

Here is a metric version. The max depth is around -3mm, so a 10mm diameter 90-degree V-cutter should be OK. The text should be roughly 100mm long: emc2_vcarve_mm_ver2.ngc

Disclaimer: This is experimental code. Warnings, Errors, and Segfaults are common.

Graph filters

I've put together two graph filters that can be applied to the VD.

The first one detects the interior or exterior of a polygon. When the VD is constructed the polygon boundary must be input in CW order, and any islands inside the polygon in CCW order (or vice versa). This allows running other downstream algorithms only on the parts of the VD that pass the filter. Like these exterior and interior offsets:


The other filter looks at the interior VD and tries to produce an approximate medial axis. We can start with the complete interior VD, such as this "J":

By definition the medial axis consists of "the set of all points having more than one closest point on the object's boundary". The separator edges shown in purple above can clearly be eliminated, since their adjacent/defining sites are an open line-segment and the segment's endpoint. Removing separators gives us this:

Now we can either finish here, or try to filter out some more edges to make it look better. Since we approximated smooth curves with line-segments we should try to detect which parts of the boundary are really distinct curves, and which are merely many consecutive line-segments approximating a single smooth curve. I've compared the dot-product (angle) between two consecutive segments, and applied an arbitrary threshold:

For the whole alphabet it looks like this.

The choice of threshold value for the angle-filtering is arbitrary. In many cases such as "x" and "m" it results in small or large left-over branches. This could probably be avoided by (1) tuning the angle-threshold, (2) approximating smooth curves with a larger number of line-segments, (3) eliminating branches below a certain length, or (4) choosing a font that's made for v-carving (are there any?).


Although it's probably not right to call it a "medial axis" , the same filter applied to the exterior VD also looks interesting. It divides the plane into organic looking shapes around each letter. It could probably be used for a lot of shape analysis. For example in a smart pocketing routine to find large areas that can be cleared with a large cutter, before a smaller cutter is required for the details. Note that in addition to the geometric shape of all the blue-ish edges the diagram also holds distance-information at each point of an edge. The distance stored is a clearance-disk radius, i.e. we can draw a circle at any point of an edge with this radius, and no input geometry (in yellow) will intersect the circle.

2D Offsets

Once we have a VD it is almost trivial to calculate 2D offsets. While the VD for n line-segments takes O(n*log(n)) time to calculate, the offset-generation is a simple "march" that takes O(n) time. In this "A" example it takes 24 milliseconds to calculate the VD and less than 1 millisecond to produce all the shown offsets. Input geometry in yellow, VD in blue. Offset lines in light-green and offset arcs in slightly darker green.

Here is a larger example where VD takes 1.3 seconds, and all offsets shown take 99 milliseconds in total to produce. It would be interesting to benchmark this against libarea or other open-source 2D offset solutions. (here all line/arc offsets in one green color, for simplicity)

Here is a third picture with offsets for a single offset-distance:

VD Alphabet

There was an issue with handling collinear line-segments, which is hopefully now fixed. OpenVoronoi seems to deal OK with most characters from ttt now.

I am still getting some Warnings about numerical instability from LLLSolver, possibly related to these high-degree vertices which don't look quite right (this is a zoom-in inside the circular dot of "j" in the picture above):

I should write a class for extracting offsets next. Then perhaps medial axis (if anyone is interested in v-carving toolpaths).

TTT++ and font-vd

Update: Now all the capital letters work!

I wanted to test my VD algorithm on font-outlines. So I ported Chris Radek's truetype-tracer to c++ and added some python bindings. Here: https://github.com/aewallin/truetype-tracer

Because my VD code cannot handle circular arcs yet, I took some old code from TTT 3.0 and made converting conics and cubics, the native output of FreeType, as well as arcs into line-segments optional.

Predictably, OpenVoronoi crashes in many cases, but here is an "L" that works:

VD for polylines and polygons

I've been hacking away at openvoronoi, adding support for polylines and polygons.

The code I had in November works with individual non-intersecting line segments, like this:

Note how each vertex in the figure above is of degree three, i.e. there are three edges incident on each vertex. There's something about the number three, or triangles, or both, that makes planar graphs of degree three particularly nice to work with.

Here's the same figure with some notes describing the elements. The line-sites are drawn in yellow, and are associated with their left R(L+) and right R(L-) regions. The purple lines are called separators, and they define the region associated with the start- or end-point of a line-site. The three possible edge-types are also shown: LineEdge between two point-sites, LineEdge between two line-sites, and a Parabolic (PointLine) edge between a point-site and a line-site.

Now, things get more complicated when we want to 'glue' two line-segments end-to-end in a polyline, or glue three or more line-segments together to form a polygon. Vertices are not necessarily of degree three any more. In fact the vertex degree is essentially unbounded, as you can start/end arbitrarily many line-segments at the same vertex. The solution I am using is to introduce what I call a null-face with zero-length null-edges around each point-site to which more than one line-segment connects. The mental picture is much like that of a key-chain, or mountaineering carabiners that are hooked-in to a loop. When we want to use the a vertex as a start/end-point for a segment we 'hook-in' to the null-face:

This introduces a number of new rules and associated code for how vertices should be created, removed, and moved around a null-face, but it seems to work somehow now:

Note how these null-faces and the circular null-edges around each end-point result in degree three vertices, which are much nicer to deal with in the algorithm. For example, the null-face around vertex "0" is 40->85->86->41->39. Without the null-face construction this vertex would be of degree five. Here is an annotated version of the same picture:

This image shows how the diagram divides the plane into regions associated with endpoints such as R(0) and with the right/left side of a line-segment such as R(0-29) and R(29-0). The null-edges that form null-faces around each end-point are drawn in white.

Of course, these null-edges are only a topological construction. Geometrically we can position each vertex on a null-face at the location of the encircled point-site. This effectively contracts away the zero-area null-faces, and the result is the diagram we want:

The code now runs for a few select test-cases. To be continued...

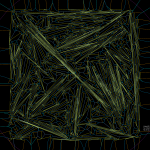
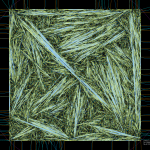
Update: The code now seems to work also for random polygons with a large number of vertices. Here is one with 400 vertices:
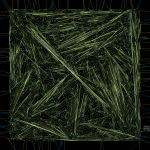
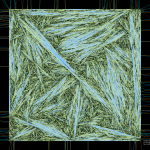
and 3200-vertices:

Call graph

For profiling I made a small c++ program which calculates a poisson voronoi diagram. When called through valgrind like this (under valgrind the program will run roughly 50 times slower than normal)
valgrind --tool=callgrind -v ./ovd_tst --n 1000
I can then use kcachegrind to draw a call graph.

I thought the nearest-neighbor grid-search (grid_find_closest_face()) would cost much more than it does.

The callee map may in fact better visualize where CPU time is spent:

The map changes significantly if we change the solver number type to double, which is faster but less accurate. A better strategy might be to run the fast solver(double) first, then check the quality of the solution, and run the slow solver(qd_real) only if necessary.

In this map there doesn't seem to be an obvious bottleneck or 'hot spot' in immediate need of optimizing, since there are 6-8 blocks/functions each taking roughly 10% of the CPU time.

After some tweaking the benchmark (with the double solver) run gives these results:

Poisson Voronoi diagram statistics

On g+, John Baez linked to work by Henk Hilhorst on the probability of finding voronoi cells with n sides in a poisson voronoi diagram.

A poisson voronoi diagram has point sites randomly and uniformly distributed, like this:

Here's the distribution I came up with, after counting the edges for each voronoi cell from 200 runs where openvoronoi generated the diagram for 100k point-sites in each run. The green line is Hilhorst's prediction. I'm assuming poisson statistics, so if the bin-count for a certain n is fn, I've drawn errorbars of length sqrt(fn). Cells with n=15 or n=16 are so rare that the statistical error is of the same size as the probability (but it does agree with Hilhorst's prediction). Among the 20M cells I looked at I did not find n >= 17. For n=17 the predicted probability is 2e-9, so there's should be a 50% chance of seeing one if I would produce 500M random cells (that would take about 7 hours of CPU time).

The relevant papers are

The logarithmic y-axis hides the fact that the distribution is very peaked around n=6, so here is a plot with a linear y-axis:

Random line-segment voronoi diagram

Update3: version 11.10-148 now goes to 16k line-sites without errors or warnings:

Update2: This diagram with 8k vertices clearly has errors:

Update: Version 11.10-141 now copes with 4k random segments. But I don't know of any smart way to check the diagram for correctness..

Constructing the vd for random (non-crossing) line-segments is a reasonable stress-test for my vd-algorithm. When you've fixed one bug, just increase the number of line-segments by a factor of two and you will most likely uncover another! It now runs OK up to 2048 line-segments (yes, that does imply I get a segfault at 4096!).

There's some slowdown from 5us*n*log(n) in september 2011 (for just point-sites), to this code which runs in about 15 to 20us*n*log(n) when inserting the point-sites. Line-sites take longer, about 200us*m*log(m) for m line-sites.