Voronoi diagram algorithm animations

I've made some more progress with my voronoi diagram code. I described the topology-oriented incremental algorithm earlier here (point sites) and here (line segments). When we want to add a new site (a point or a line-segment) to the diagram we should find a tree of to-be-deleted vertices/edges (red), create new (green) vertices on all in-out edges, and hook up the new vertices with new edges (green) to form the face for the new site. For point sites it looks like this(click thumbnail to see GIF animation!):

For line-segment sites we need to modify the in_circle() predicate to calculate the minimum distance from a point to a line-segment. Then we need a much more involved solver that figures out points that are equidistant from points/lines. There are four different cases: point/point/point, point/point/line, point/line/line, and line/line/line (or you could identify a fifth and sixth type of vertex if you treat the case where one vertex is a line-segment endpoint differently, see drawing here).

In addition to simple line-edges between two point-sites we now also get two new types of edges: between line/line sites we have line-edges (but parametrized a little differently), and between point/line sites we have parabolic edges. The basic algorithm however looks pretty similar: we again find the delete-tree (red), create new vertices (green), and hook them up with new edges (green) to form a new face. (again click thumbnail to see GIF animation!).

There are (at least!) two more complications arising with line-sites that don't show up with just point-sites. These are handled with additional APEX and SPLIT vertices, which don't really add new geometry or topology to the diagram, they just make the algorithm handle certain special cases correctly.

It turns out that with parabolic edges there can be cases where both endpoints of the edge are marked IN (red, or to-be-deleted), but some parts of the edge still needs to be preserved. To handle this case correctly we insert a new type of APEX vertex at the apex of each parabolic edge. These APEX vertices can be seen at the tip of each parabola in the GIF-animation above.

The second special case is more subtle. There can be situations where the algorithm finds a to-be-deleted set of vertices that contains a loop/cycle. This is obviously forbidden because that would delete a face from the graph - which isn't allowed. That's why we require the delete-set to be a tree. Here is an image:

We are inserting a new line-segment (yellow) starting at 48. The IN-vertices already found are colored red. Vertex 142 should be marked IN because it is closer to the new line-segment than to any other site. However that would create a loop of red vertices (134-135-143-148-142-138) and the face corresponding to the point-site 133 would be deleted. The problem is similar to that with APEX points: the end-points of edge 148-142 are both marked IN, but the edge should not be deleted completely. To handle this case we need to insert a SPLIT vertex at a position on the 148-142 edge which will be preserved(i.e. marked OUT). We do this by projecting the site 133 onto the edge 148-142 using the line-segment(yellow) as a mirror. This vertex will be marked OUT and ensures that the 148-142 edge is not completely removed. The same reasoning should work for circular arc-sites where we project radially through the center of the arc.

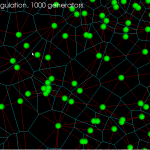
Here is a longer animation (best watched at 1080p/fullscreen!) which shows the insertion of 100 point-sites followed (after around 1:15) by insertion of (non-crossing!) line-segments:

The code now runs without errors until about 50 line-segments. There are problems with finding the proper end-points for separators in degenerate cases where the solver positions vertices on top of each other or very very close to each other.

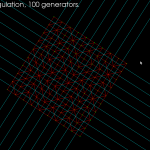
Update: Some further bugfixes and filtering solution-points by both maximum and minimum t-value (clearance disk radius) has made the code run without assert()'s or problems up to N=100 line-segments:

Update2: now up to 200 line-sites:

Update3: Here is one case which I have identified as "hard" for the vd-vertex location solver code. We have as input to the solver a line-segment, one of its endpoints, and a third site (in this case also a line-segment). In some cases it happens that the offsets (dashed lines) of these three input sites are nearly parallel, which results in bad numerical precision, and the resulting solution can have an error which is as much as 1e9 times the normal errors I see.

Line-segment voronoi diagram progress.

I've made some progress with my voronoi diagram code:

Sites/generators in yellow. Line-edges in cyan, parabolic edges in red. Note that the parabolic edges are split at their apex, i.e. the closest point to the adjacent site.

Some problems with hooking up the half-edges of the two new faces that are associated with a new line-site remain. Hopefully soon to be fixed.

This code should in principle work for circular arc sites too. Adding arcs to the diagram results in elliptic and hyperbolic edges (in addition to line and parabola, which seem to work now).

vd benchmark

Tuesday update: A few optimizations has shaved about half off the constant, to . This was mainly (a) choosing boost::vecS as the out-edge container for the BGL-graph, and (b) choosing std::vector instead of std::set for a temporary variable in the grid-search for the closest facet. I suspect the runtime is dominated by that grid-search. Profiling would tell.

I did some benchmarking of my vd-code. It is supposed to run in time. Benchmarking turns out to be not so simple. I normally compile without any optimizations, and with a lot of sanity-checks and assert():s all over the code. These checks have worse time-complexity and result in long runtimes with big inputs. Then there are compiler optimization flags like -O or -O3.

I was first running the algorithm by inserting each point from python-code:

    t_before = time.time()
    for p in plist:
        vd.addVertexSite( p )
    t_after = time.time()
    return (t_after - t_before)

which I thought could add some overhead. I also made a version ("batch mode") where we first push all points to c++, and then call a run() method:

    for p in plist:
        vd.pushVertexSite( p )
    t_before = time.time()
    vd.run()
    t_after = time.time()
    return (t_after - t_before)

but this seems to improve runtime only marginally. Here are the results. Runtimes are divided by , so ideally all points should fall on a horizontal line. At best the code now runs in about 10-16 microseconds times .

With 4096 input points the runtime improves from 12s down to 1.3s by turning off sanity-checks and assert():s. It further improves to 0.18s with -O3 and to 0.165s in batch-mode.

As an example, the voronoi diagram for 1000 random points looks like this:

Line-segment voronoi diagram notes

The next step for the opencamlib voronoi-diagram (vd) algorithm is to be able to add line-segment generators. Some notes and ideas on that then (this turned into a rather long post...)

First let's recall (from February) how the point-generator vd-algorithm works:

In (A) we want to insert a new point-generator (yellow). First we need to identify the closest point-generator among the existing generators. (B) Then among the vertices that bound this voronoi-face(region) we search for a seed vertex (pink). The seed vertex is the one that violates the inCircle-predicate the most, i.e. has the minimum distance to the new point-to-be-inserted. (C) Starting from the seed vertex, we then identify other vertices (red) that need to be deleted, because they are closer to the new generator than to any other generator. These vertices are called "IN" vertices, and the associated edges (also in red) should (i) form a tree (a connected acyclic graph) and (ii) for any face, the "IN"-vertices should be connected, and the "OUT" vertices should be connected. (D) IN-IN edges (red) will be deleted completely, while NEW vertices will be generated on each IN-OUT edge (green). (E) NEW-NEW edges are created and connected into a cycle which forms the face/region for the new generator. (F) Now all IN-vertices and all IN-IN as well as IN-NEW edges are deleted and we are done.

Now the case when we insert a line segment. We start as above by constructing the diagram for all point-generators as well as all the endpoints of our line-segments. Here is an image from the Sugihara&Iri 2000 paper (http://dx.doi.org/10.1007/s004530010002) which I have enhanced with colors and text.

The steps of the algorithm are similar to (A)-(F) above: In (A), since we have already inserted the two endpoints of the line-segment, we obviously know in which face to look for the seed-vertex. (B) when we search for a seed-vertex we now need both a dist(VDVertex, PointGenerator) function and a dist(VDVertex, LineGenerator) function. In (C) we again expand the set of "IN" vertices (red circles), while keeping the associated graph a tree, and not disconecting "IN"-vertices or "OUT"-vertices of any face (i and ii above) .

A new (iii) requirement is that the tree should connect the regions of the line-segment endpoints. A new situation also appears where the two endpoints of an edge are classified as "IN", but the complete edge should not be deleted. This is because edges between point and line-segment generators are parabolic arcs (curved!). In this case two NEW vertices are generated on the edge, so it splits into three parts: IN-NEW, NEW-NEW, and NEW-IN. This needs to be dealt with, but I'm not sure exactly how. I think one of the Held papers talks about avoiding this special case by splitting each parabolic edge in two, at the "vertex" of the parabola i.e. the point of greatest curvature (?).

"IN-IN" edges (magenta) will again be deleted. (D) NEW-vertices (green) should now be generated on each IN-OUT edge. This needs new functionality, since we need to deal with two types of edges: LineEdge and ParabolicEdge. The LineEdge occurs between two PointGenerators or between two LineGenerators, while the ParabolicEdge appears between a PointGenerator and a LineGenerator. The NEW vertex we need to generate will obviously be located on the IN-OUT edge (with associated generators gen1, gen2), and should be positioned so that it is equidistant from gen1, gen2, and the new line-segment generator. In contrast to the old point-generator diagram code where we only had one type of VDVertex, namely VDVertex( PointGenerator, PointGenerator, PointGenerator), we now have 6 (six!) different types of vertices in the diagram, depending on the three neighbouring generators, which can be of type LineGenerator, PointGenerator(endpoint), or PointGenerator:

  • VDVertex( PointGenerator, PointGenerator, PointGenerator), type V1 in Okabe et al.
  • VDVertex( PointGenerator, PointGenerator(endpoint) , LineGenerator), type V2
  • VDVertex( LineGenerator, PointGenerator, PointGenerator), type V3
  • VDVertex( LineGenerator, LineGenerator, PointGenerator(endpoint) ),  type V4
  • VDVertex( LineGenerator, LineGenerator, PointGenerator ), type V5
  • VDVertex( LineGenerator, LineGenerator, LineGenerator ), type V6

When these NEW-vertices (green) have been created, the next step is to connect them into a cycle with NEW-NEW edges (green). As we loop around the face we need to create either LineEdges or ParabolicEdges, depending on the neighbouring generators. Okabe lists the four different types of edges that appear in the diagram:

  • VDEdge( PointGenerator, PointGenerator), type E1 (LineEdge)
  • VDEdge( PointGenerator(endpoint), LineGenerator), type E2 (LineEdge)
  • VDEdge( PointGenerator, LineGenerator), type E3 (ParabolicEdge)
  • VDEdge( LineGenerator, LineGenerator), type E4 (LineEdge)

That's about it. It shouldn't be that hard to modify the current code to allow for six types of different VDVertex and four different types of VDEdge, and come up with a suitable design-pattern so that the correct type of vertex and edge are generated based on the type of the generators. Stay tuned...

Update1: here is another image with the same color-coding, from the Held VRONI-paper. The orange edge illustrates a case where the edge is marked "IN-IN" but in fact two new vertices should be generated on it, and the NEW-NEW portion of the edge is retained in the updated diagram (on the right).

Update2: Here is an image from the Held 2009 paper, which describes VDs for line-segment and circular arc generators. The circular arcs add a few additional special cases and some complexity, but the core of the algorithm remains the same: (1) find a seed vertex, (2) expand the set of 'marked' or "IN" vertices maximally, while keeping IN-IN edges (red) a tree, (3) generate NEW vertices (green) on IN-OUT edges (cyan), (4) hook up the NEW vertices with new edges (green) to form the new voronoi region, (5) delete IN-vertices, IN-IN edges, and IN-NEW edges.

Update3: Here's a drawing which shows the six different types of vertices.

VD algorithm animation

Some notes on the Sugihara&Iri 1994 topology-based algorithm for incremental construction of the voronoi diagram for point sites.

(A) We start with initial VD for point sites that have already been inserted. We want to insert a new site, shown as a yellow sphere.

(B) We then find the VD face to which the new vertex belongs. Among the vertices that bound this face we search for a seed-vertex, shown in pink. This is the vertex that is closest to the new generator.

(C) From the seed vertex, we search for more vertices that should be deleted(red). The vertices should form a tree (a connected, acyclic graph). Vertices that are closer to the new site than to any other site should be deleted. However due to floating-point errors it's not possible to blindly rely on an inCircle() predicate for finding the delete-tree. It's necessary to also enforce the correct topology, namely (i) the delete-vertices should form a tree, and (ii) for any incident face, the delete-vertices are connected. This ensures that no old face of the graph is deleted or split in two.

(D) Identify the edges to be deleted (red), and edges on which we need to generate new vertices (green).

(E) Generate new vertices on the green edges, and connect all the new vertices by new edges. These new edges form a new face corresponding to the newly inserted site.

(F) Remove the red/delete-vertices and edges. We are left with what we want: the VD of all the old sites and the new site.

Another picture from the original 1994 paper. The new site is not shown, but by some process we have found the delete-tree (u1,u2,u3,u4) shown as solid dots. New vertices are then generated on the "in-out" edges (u2-u10, u2-u5, u3-u6, u3-u7, u4-u8, u4-u9), shown as unfilled dots. The unfilled dots are connected with new edges (dashed lines) that form the new facet (shaded area). Image borrowed from: Sugihara&Iri 1994.

Here is an animation of the algorithm at work when inserting about 100 random points:

VD shapes

vd_shapes

Note how the Delaunay triangulation (in red) is not correct. The outside of true Delaunay triangulation should form the convex hull of the input points, which is clearly not the case here(see how the red lines around the ellipse-shape are not tangents). What's going wrong? It has to do with how the algorithm avoids infinite or unbounded voronoi-edges. Before any real input generator points are inserted we start with three special generator vertices and the corresponding vd. A zoomed out view is shown below. If the cyan vd edges extending outward from the ellipse would stretch out to infinity then we would indeed recover the true Delaunay triangulation. The Voronoi diagram should however be correct inside the orange circle. I'm not sure how the true Delaunay triangulation could constructed with this algorithm.

zoom_out

VD pics

Some progress on the voronoi-diagram algorithm. It doesn't crash easily now with random or regular input points. Not crashing is good, but whether the output converges towards the correct diagram or not remains to be seen...