Power Law Noise Identification for AllanTools

For AllanTools statistics both bias-correction and confidence interval calculation requires identifying the dominant power law noise in the input time-series.

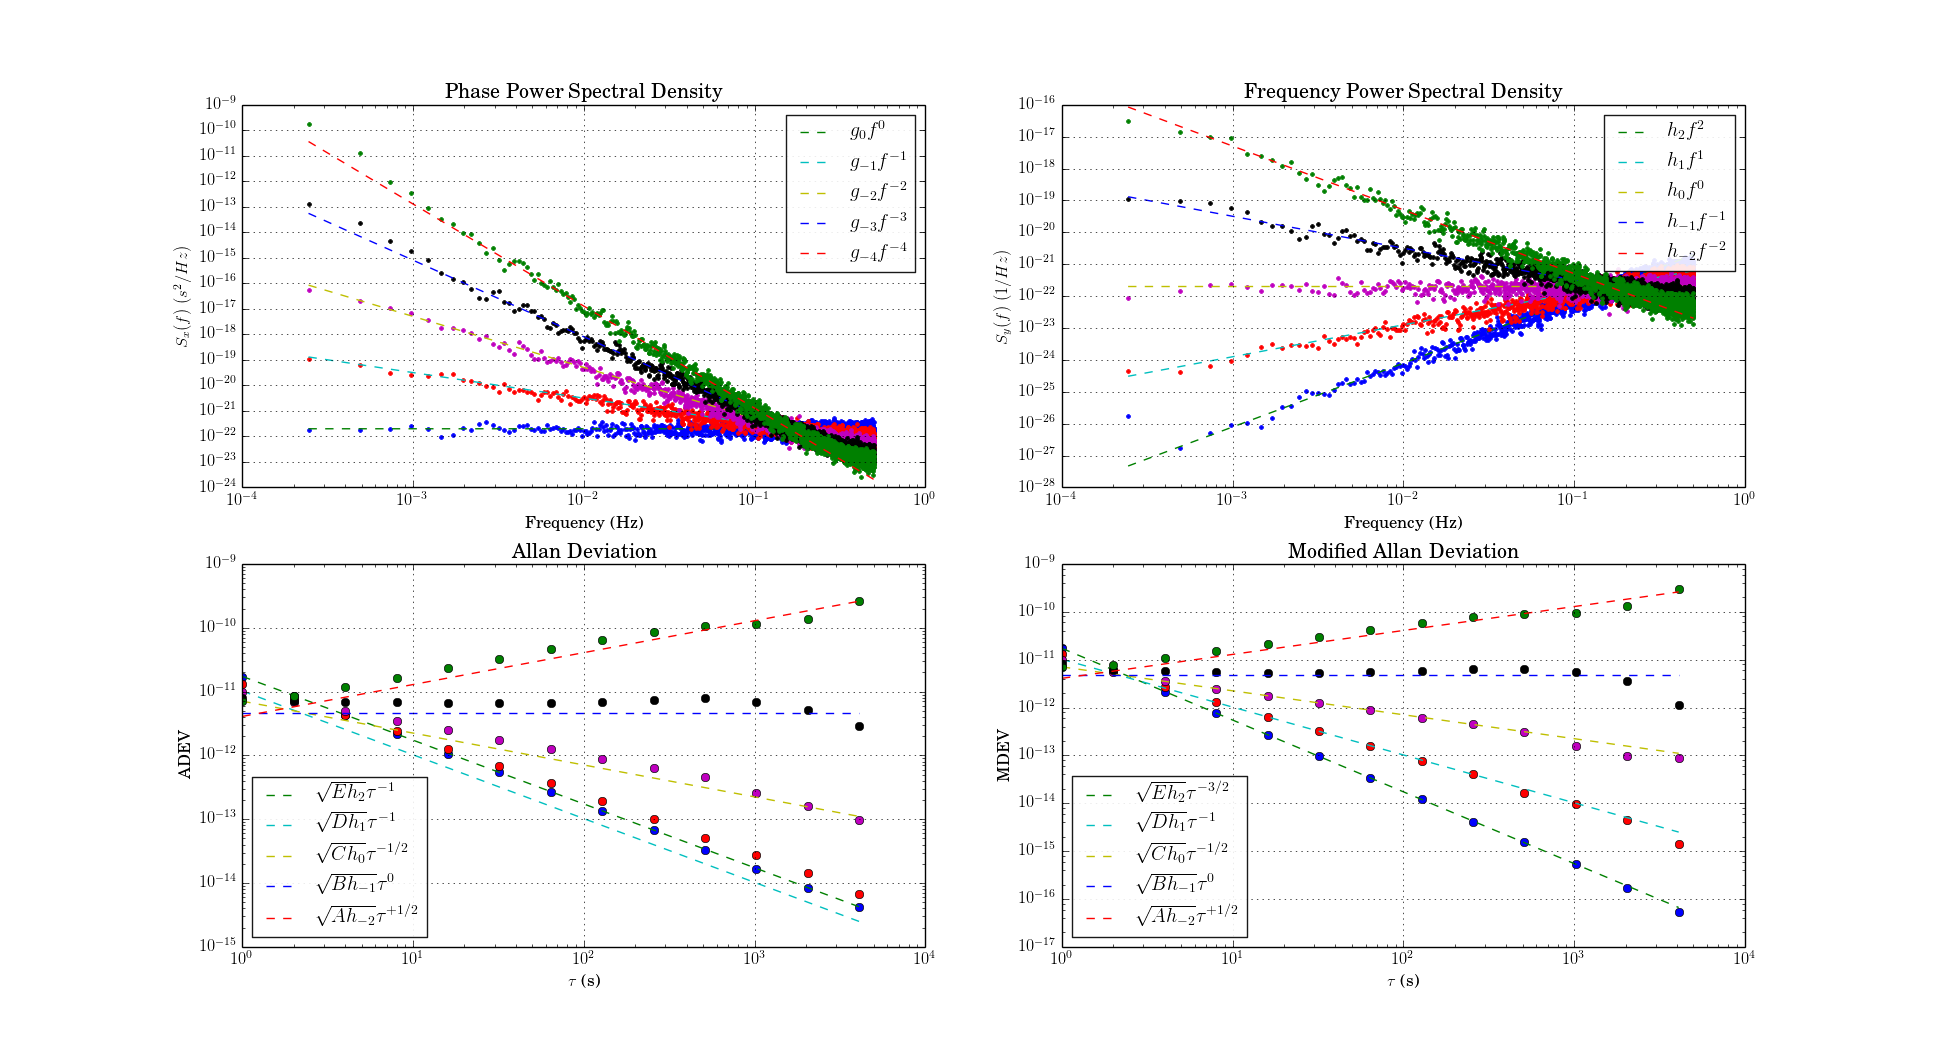
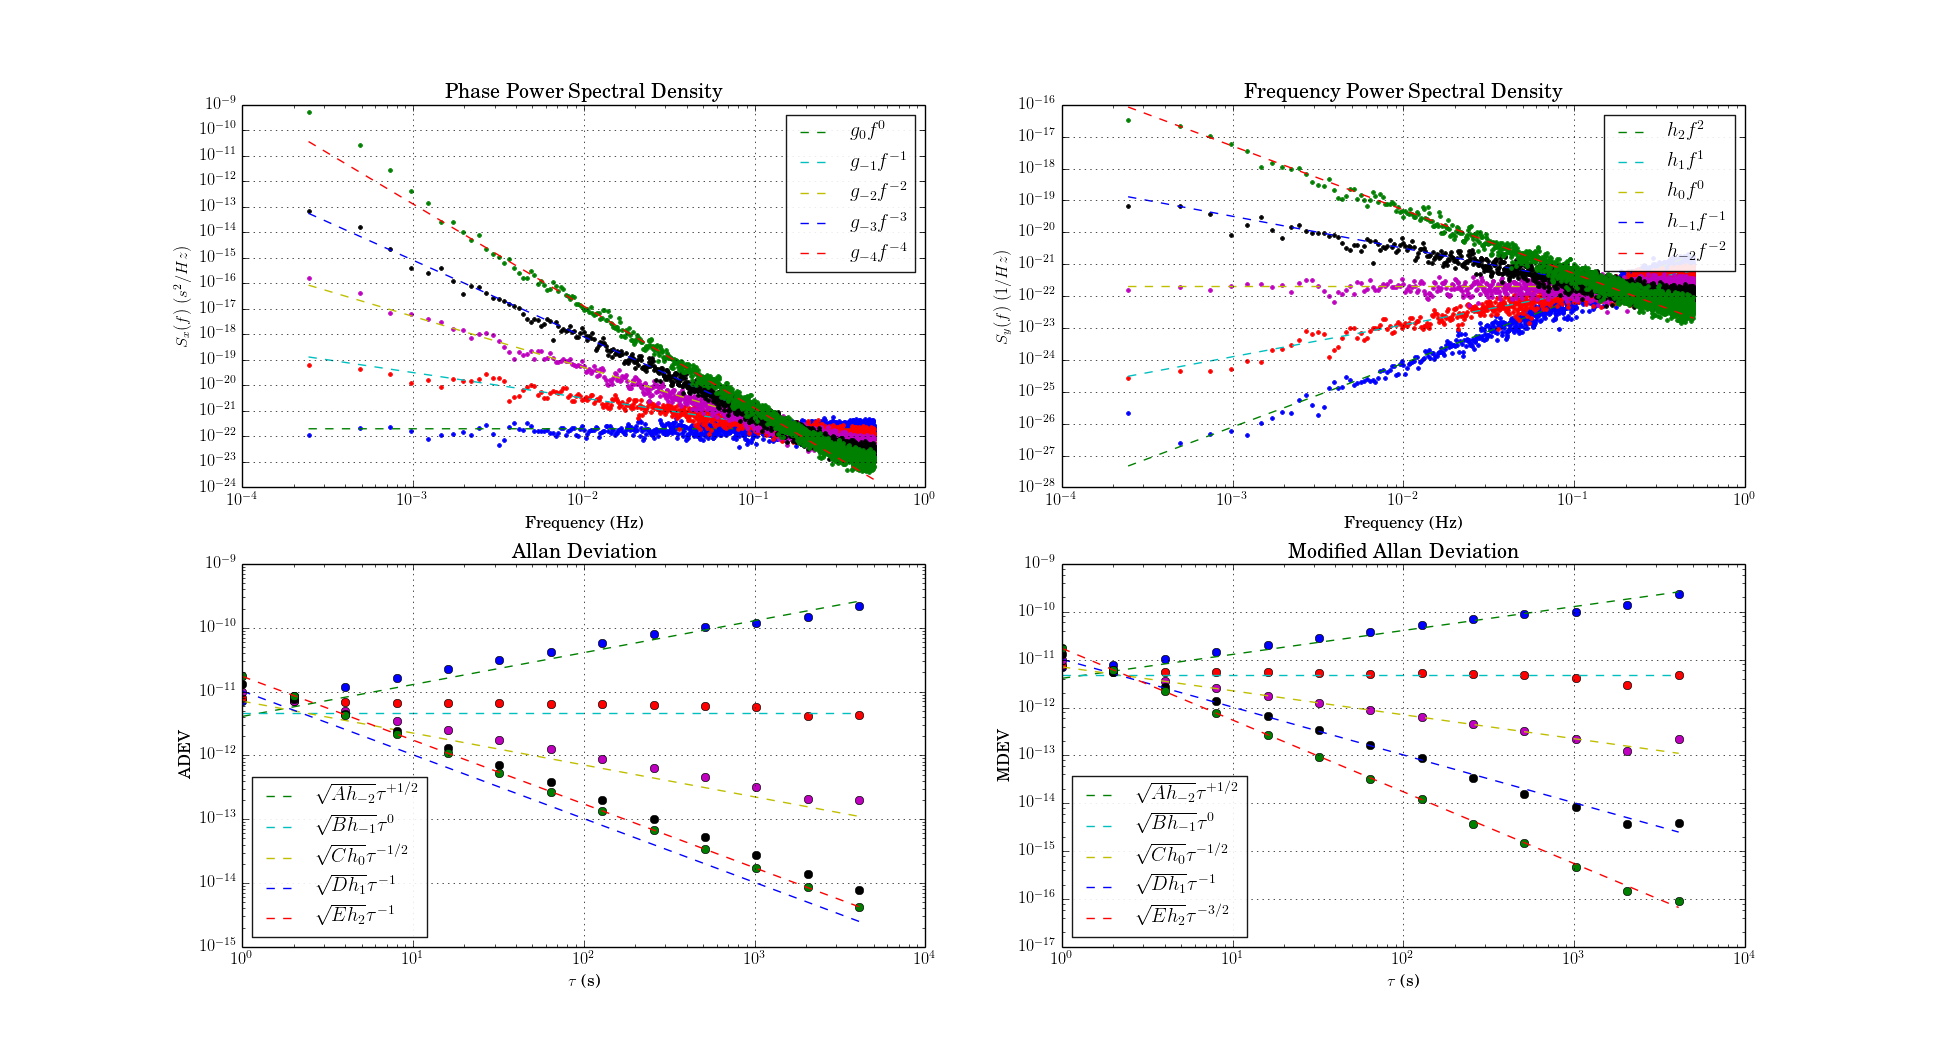
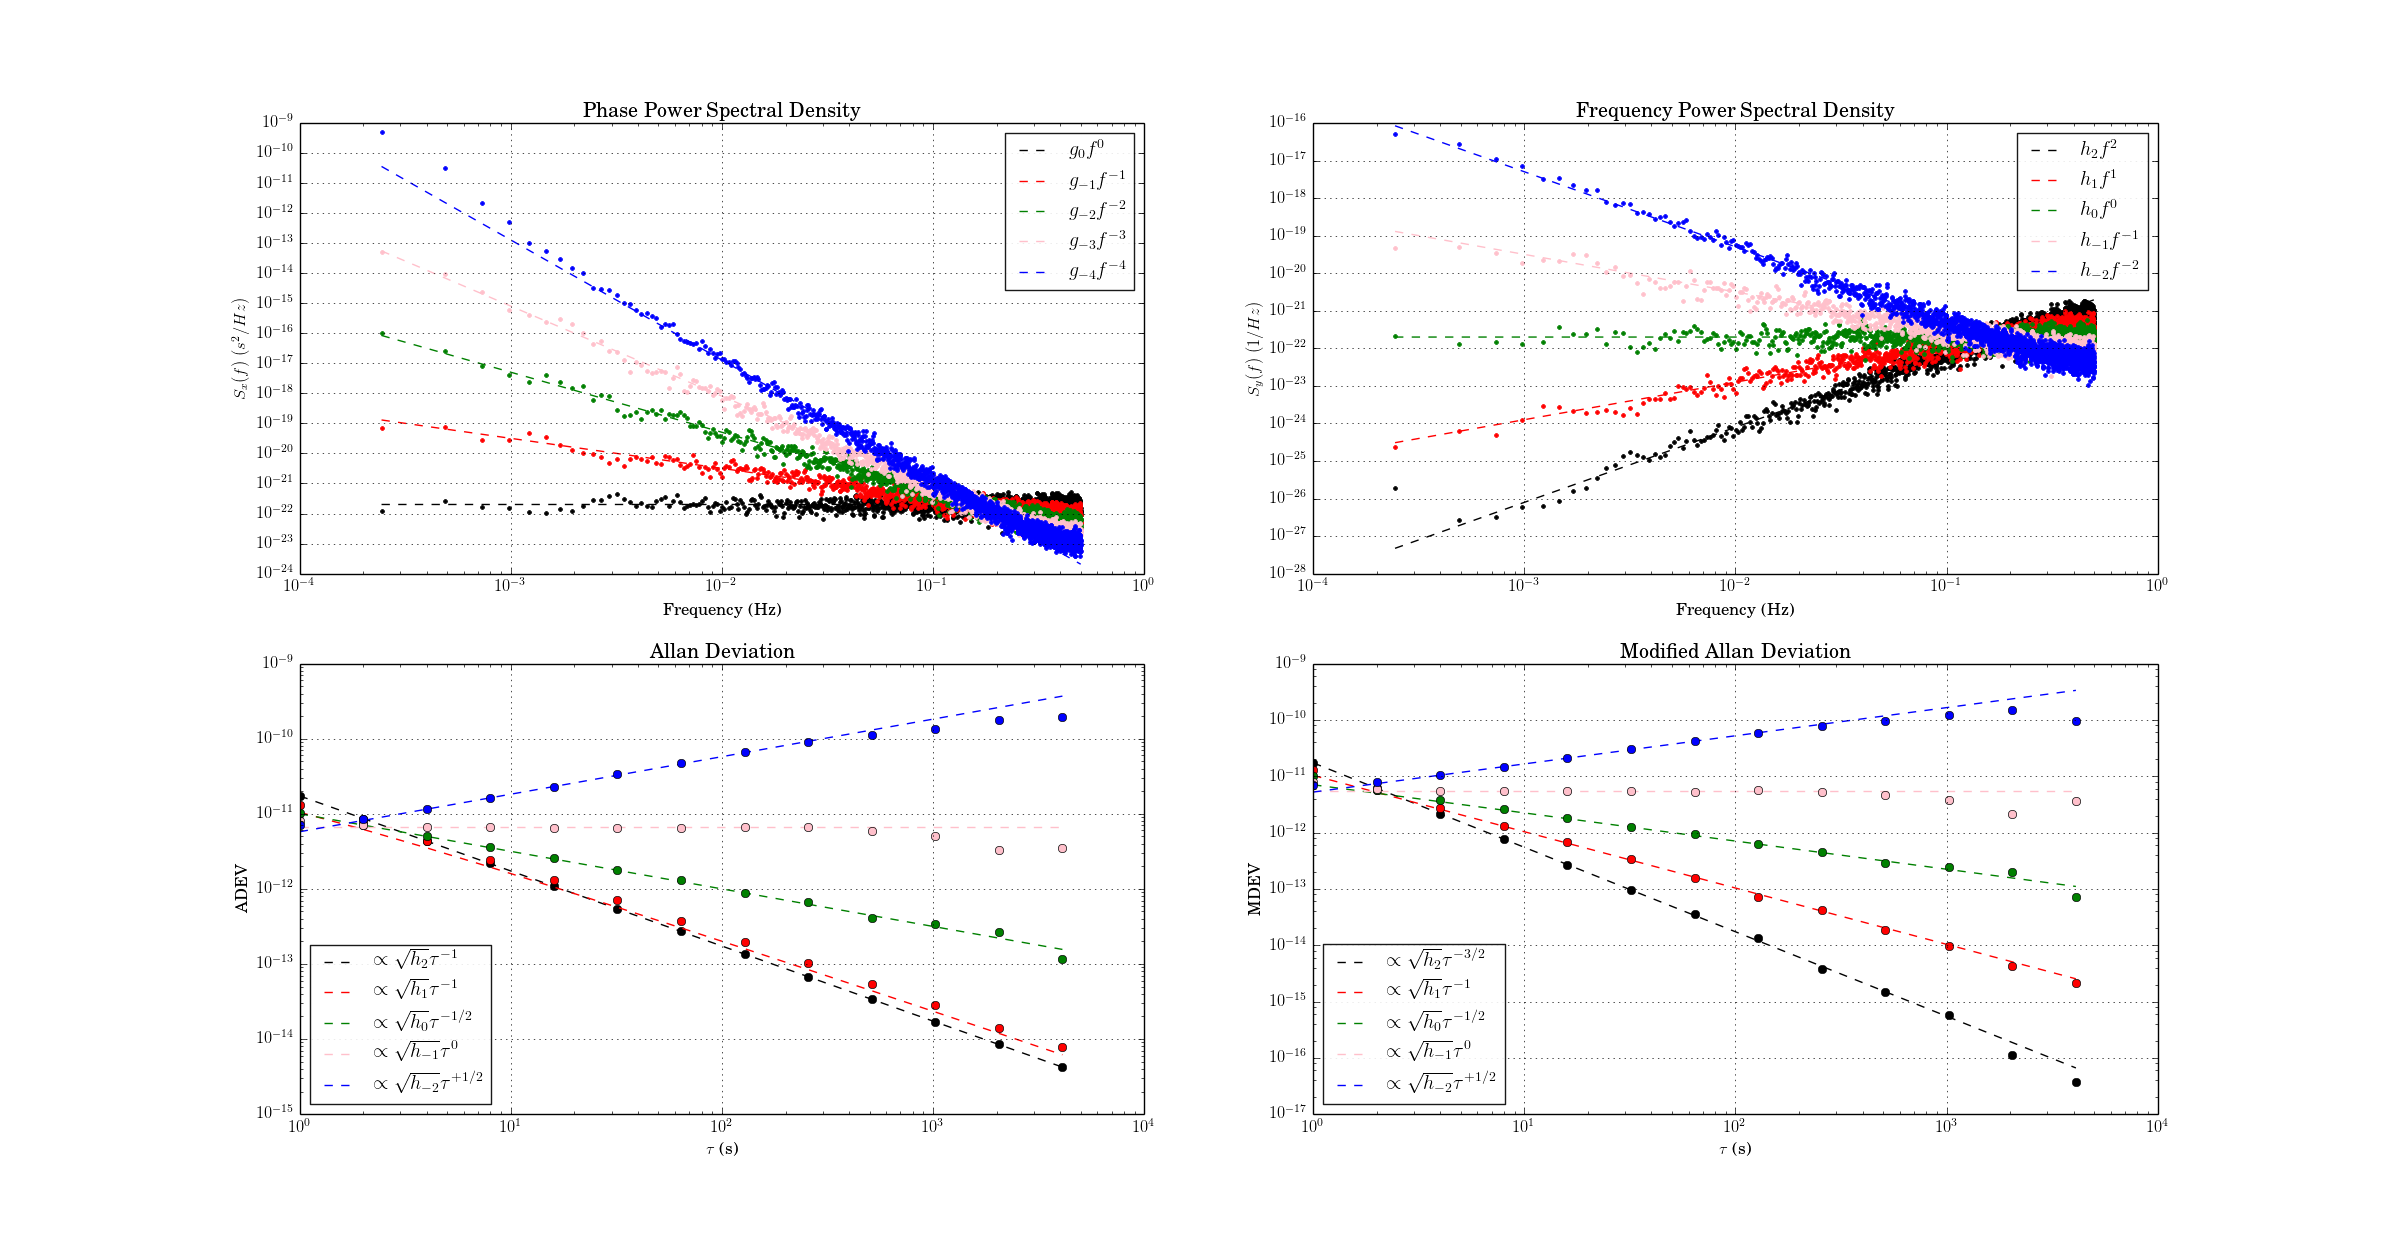
The usual noise-types studied have phase PSD noise-slopes "b" ranging from 0 to -4 (or even -5 or -6), corresponding to frequency PSD noise-slopes "a" ranging from +2 to -2 (where a=b+2). These 'colors of noise' can be visualized like this:


Four colors of noise. Note frequency PSD slope "a" related to phase PSD slobe "b" by a=b+2. Lower graphs show tau-slopes "mu" for ADEV and MDEV. Data point colors don't match with figures below - sorry.

I've implemented three noise-identification algorithms based on Stable32-documentation and other papers: B1, R(n), and Lag-1 autocorrelation.

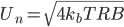
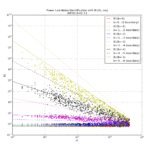
B1 (Howe 2000, Barnes1969) is defined as the ratio of the standard N-sample variance to the (2-sample) Allan variance. From the definitions one can derive an expected B1 ratio of (the length of the time-series is N)

where mu is the tau-exponent of Allan variance for the noise-slope  defined by b (or a). Since mu is the same (-2) for both b=0 and b=-1  (red and green data) we can't use B1 to resolve between these noise-types. B1 looks like a good noise-identifier for b=[-2, -3, -4] where it resolves very well between the noise types at short tau, and slightly worse at longer tau.

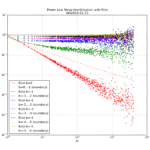
R(n) can be used to resolve between b=0 and b=-1. It is defined as the ratio MVAR/AVAR, and resolves between noise types because MVAR and AVAR have different tau-slopes mu. For b=0 we expect mu(AVAR, b=0) = -2 while mu(MVAR, b=0)=-3 so we get mu(R(n), b=0)=-1 (red data points/line). For b=-1 (green) the usual tables predict the same mu for MVAR and AVAR, but there's a weak log(tau) dependence in the prefactor (see e.g. Dawkins2007, or IEEE1139). For the other noise-types b=[-2,-3,-4] we can't use R(n) because the predicted ratio is one for all these noise types. In contrast to B1 the noise identification using R(n) works best at large tau (and not at all at tau=tau0 or AF=1).

The lag-1 autocorrelation method (Riley, Riley & Greenhall 2004) is the newest, and uses the predicted lag-1 autocorrelation for (WPM b=0, FPM b=-1, WFM b=-2) to identify noise. For other noise types we differentiate the time-series, which adds +2 to the noise slope, until we recognize the noise type.

Here are three figures for ACF, B1, and R(n) noise identification where a simulated time series with known power law noise is first generated using the Kasdin&Walter algorithm, and then we try to identify the noise slope.

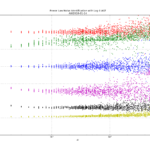
For Lag-1 ACF when we decimate the phase time-series for AF>1 there seems to be a bias to the predicted a (alpha) for b=-1, b=-3, b=-4 which I haven't seen described in the papers or understand that well. Perhaps an aliasing effect(??).


Five colours of noise

Update: now with the colours matching in all graphs:

colorednoise

Time-series generated with colorednoise (following Kasdin&Walter), power-spectral-densities and Allan deviations computed with allantools, and compared to theoretical predictions in IEEE1139-2008.

colorednoise

The PSD lines and MDEV lines seem spot-on, but are the ADEV lines systematically a bit low?

Code here: example_noise_slopes.py

ADF4350 PLL+VCO and AD9912 DDS power spectra

Update 2015-09-28: ADEV and Phase-noise measured with a 3120A:


Here's the 1 GHz output of an ADF4350 PLL+VCO evaluation board, when used with a 25 MHz reference.

The datasheet shows a phase noise of around -100 dBc/Hz @ 1-100 kHz, so this measurement may in fact be dominated by the Rigol DSA1030A phase noise which is quoted as -88 dBc/Hz @ 10 kHz.

1GHz_adf4350_output_with_25MHz_ref-input

The 1 GHz output from the ADF4350 is used as a SYCLK input for an AD9912 DDS. The spectrum below shows a 100 MHz output signal from the DDS with either a 660 MHz or 1 GHz SYSCLK. The 660 MHz SYSCLK is from a 10 MHz reference multiplied 66x by the AD9912 on-board PLL. The 1 GHz SYSCLK is from the ADF4350, with the AD9912 PLL disabled.

The AD9912 output is clearly improved when using an external 1 GHz SYSCLK. The noise-floor drops from -80 dBm to below -90 dBm @ 250 kHz from the carrier. The spurious peaks at +/- 50 kHz disappear. However this result is still far from the datasheet result where all noise is below -95 dBm just a few kHz from the carrier. It shouldn't matter much that the datasheet shows a 200MHz output while I measured a 100 MHz output.

Again I suspect the Rigol DSA1030A's phase-noise performance of -88dBc/Hz @ 10 kHz may in fact significantly determine the shape of the peak. Maybe the real DDS output is a clean delta-peak, we just see it like this with the spectrum analyzer?

100MHz_AD9912_internal_vs_external_PLL

Martein/PA3AKE has similar but much nicer results over here: 1 GHz refclock and 14 MHz output from AD9910 DDS. Amazingly both these spectra show a noise-floor below -90 dBm @ 50 Hz! Maybe it's because the spectrum analyzer used (Wandel & Goltermann SNA-62) is much better?

Noise equivalent temperature in an RTD/Thermistor

How accurately can you in principle measure temperature with an RTD or thermistor?

If we push a current through the resistor we'll get a voltage of across it. Now as the temperature changes the resistance will change by where is the temperature coefficient of the sensor. This will give us a signal


On the other hand the Johnson noise across the resistor will be where B is the bandwidth, and we get a signal-to-noise ratio of


The noise-quivalent-temperature (NET) can be defined as or


Here we can identify as the power dissipated in the resistor and simplify to

Here's a table with some common values for pt100 and 10k NTC thermistors. The sensitivity is determined by the sensor type. What limits is self-heating of the sensor which probably should be kept to a few milli-Kelvins in most precision applications. Thermistors with their higher sensitivity are an obvious choice for high-resolution applications, but the lower of a pt100 sensor can be compensated with a larger since most pt100 sensors are physically larger and thus have lower self-heating. pt100 sensors require 4-wire sensing, slightly more complex than a 2-wire measurement which is OK for a thermistor.

Sensor Resistance Sensitivity (divide by R to get alpha!) Dissipated Power P Noise-Equivalent-Temperature
(1Hz bandwidth)
pt100 100 Ohms 0.391 Ohms/C 100 uW (I=1mA) 3 uK
NTC Thermistor 10 kOhms -500 Ohms/C 9 uW (I=30uA) 0.9 uK

I conclude that it is not entirely obvious how to choose between a pt100 and a 10k thermistor. The thermistor is intrinsically more sensitive, but with good thermal contact to its surroundings self-heating in a pt100 sensor can be minimized and the same noise-requivalent-temperature achieved. In any case it looks like Johnson noise limits resolution to 1 uK or so in a 1 Hz bandwidth. If we AD-convert the voltage at 24-bit resolution (16M states) we can get a reasonable measurement range of ~32 K by matching 1 LSB = 2 uK.

Does anyone know of similar back-of-the-envelope calculations for other sensors (Thermocouples, AD590)?