Supercontinuum

Saw some supercontinuum (a better explanation here) generation in the lab today. At the top there's a diode laser at 808 nm (the bright white light in the pic, try photographing your TV-remote with a digicam!) that pumps a YAG laser which outputs a 1064 nm pulse. This is then converted to a 532 nm pulse through second harmonic generation and directed into a very fancy holey-fiber in which the supercontinuum is created. In the middle of the pic there are two reflections from a diffraction grating. To the right the zero order diffraction which looks like mostly 532nm to the camera/eye, and to the left the 1st order diffraction where you see a fair bit of blue to the right of the 532nm peak and a bit of yellow/red(ish) to the left of the peak.

Microfluidics test

I got some new microfluidic chips to play with today (courtesy of the Microfabrication Group at TKK). This must be cutting-edge research, since there's an article about using laminar flow cells for single molecule experiments in the latest issue of Nature Methods. I'm testing our custom-built pressure controller which controls the inlet and outlet pressures between 0 and 7 kPa with about 2 Pa resolution. There are three inlet channels (~40 um wide) with blue fluid in the top channel, clear fluid in the middle, and red fluid in the bottom channel. They all meet in the middle of the chip and there's a wider (120 um) outlet channel.

The pressure controller is similar to Fluigent's (described by Fütterer et al. in Lab on Chip), and I'm gluing the 0.6 mm PTFE tubing to the PDMS chip as described by Hartmann et al. in Lab on Chip.

The video shows a sinusoidally modulated pressure applied to each of the input channels as well as varying the pressures manually between zero and maximum.

8-channel 4th-order 60 kHz anti-alias low-pass filter

I used this Sallen-Key design to build an 8-channel 4th order low-pass anti-alias filter for a 16-bit 200 kS/s +/- 10 V AD-Converter. I calculated the components for the 60 kHz low-pass Butterworth design with this on-line calculator. Previously I've used the MAX274, but that component is limited to +/- 5 V signals. Here I really need the +/- 10 V voltage swing. The exact design calls for 2872 pF, 2452 pF, 6935 pF, and 1016 pF capacitors, but I looked at the transfer function with what values were available in 1% tolerance from Farnell, and the response looked fine with (R= 1 k, C1=C2= 2700 pF for the first stage and C1=6800 pF, C2=1000 pF for the second stage). Both the resistors and capacitors (~1.5 eur/pcs!) have a tolerance of 1 %, which according to a monte-carlo simulation should not affect the response that much. I'm using OP42 op-amps with a unity-gain bandwidth of 10 MHz, which should be adequate (100x the cut-off frequency was recommended in a guide I read, that would be 6 MHz in this case).

For testing I hooked up a signal generator and an oscilloscope and wrote a LabVIEW program to loop trough around 250 different frequencies while recording the peak-to-peak value of the filter input and output signals. The oscilloscope only has an 8-bit AD converter, but I adjusted the analogue gain between 5 V/div and 2 mV/div to achieve effectively around 16-bit dynamic range.

This is the result of testing all channels with a 20 Vpp sine wave between 100 Hz and 10 MHz. The blue curve shows the design response and the red and green curves show the maximum and minimum expected response from the monte-carlo simulation (I drew all component values from normal distributions with 1 % standard deviations). Pretty nice agreement until ~500 kHz. Here's another view of the data:

This figure shows the deviation of the real filters from the design response, again confirming that everything works as it should up to 500 kHz.

Log-log plots can be confusing, so here's a semilog plot and a linear plot of the same data:

Here are the source files for this design:

The box actually looks like this.

Aggregating and Filtering Feeds

I'm trying to keep up with the ever increasing volume of scientific publications in my own and related fields. I've been using the Biophysical Journal's email based service for some time, but lately it has been very unreliable - often alerting me about supposedly 'new' papers that have been published in 1994 or so. Another way is to subscribe to the RSS/Atom feeds many journals provide, and I've been doing that also with Google reader, but it easily means wading through 100s of papers per week.

It's clear I need a better solution, something that first aggregates all the new papers into one big feed from the journals I am interested in, and then in a second step filters the big feed down to the few new papers that contain interesting keywords. Yahoo pipes could do that, but the LabVIEW-ish editor doesn't scale very well to a situation where you have 20+ feeds and 20+ keywords you are looking for. There's also google-mashup, but it isn't open for the public yet.

A complex solution would be to set up my own Planet, but it doesn't have web-based setup and administration so requires tinkering with config files etc. which I want to avoid.

So far I've only come up with this Thunderbird-based solution:

On the left I've subscribed to a number of journal feeds and put them in a folder of their own. On the right is a list of filters I am running. Each journal feed needs its own 'dummy filter' which does nothing but moves all the entries into the 'all papers' folder. Then I can run a filter of my own that looks for things in the subject or body of the paper. It's simple, ugly, but seems to work somehow.

Please tell me there is a simpler way to do this in Thunderbird! Or is there already a good web-based service like this around?

My requirements would be:

  • able to read and aggregate: RSS/Atom etc. (whatever the journals provide)
  • set up filters that look for keywords in any field or in only one field (title, author, abstract etc.)
  • output an RSS feed with all papers, and the filtered papers that I can read with Thunderbird or Google-reader.

So far I haven't found anything that would do this in a pain-free way. The aggregation part is handled by most web-based services, but there aren't many that allow searching/filtering and can provide the results as a separate feed.

Something like this is already going on with 'virtual-journals' that aggregate papers across journals in one field (e.g. Virtual Journal of Biological Physics Research or Virtual Journal of Nanoscale Science & Technology). Papers get selected to these 'VJs' by their editors, but I'm thinking my aggregator+filter idea will be able to cover a broader range of journals and look for more specific search terms.

Microfluidics test

I've been playing around with a microfluidic channel, to be used with optical tweezers experiments later. There's clear fluid coming in from the left in the wide (ca 30um) channel, and I've colored the fluid from the top red and the fluid coming in from the bottom blue. The top and bottom channels are narrower, ca 10um.

This page should have 3 videos, but I put them on Jumpuct and they have disappeared - sorry!

Here all the channels are on at first, then the red channel is switched on/off two times.
Here's the same thing, but switching the blue channel on/off.
Here the clear channel is switched off, and the main channel fills with red/blue fluid.

It's interesting to follow the laminar flow at these very small Reynolds numbers - the fluids effectively don't mix at all (they do mix by diffusion, but very slowly) and there's a clear boundary between red and blue. At the end the clear channel is switched on again.I'm using pressurized air to drive the fluid flow, similar to a product from French company Fluigent (nice videos here and here). Their product sells for around the price of a small car, so I'm thinking I can come up with a DIY solution for slightly less. Switching is by solenoid valves that switch either high pressure or ambient pressure to the fluid bottles (2ml Eppendorfs). The pressures required are surprisingly small, here I'm using the smallest pressure my regulator will output, 5 psi, but I have a feeling this is too much... so I'll need a pressure regulator with fine control between 0 and 5 psi, any ideas?The other option is using gravity to drive fluid flow, 0.5m H2O is around 5 kPa or 0.7 psi which could be OK. The problem is you then have to switch the fluid lines directly. I tried this with solenoid pinch-valves, and the valves create huge pressure transients when switching off - completely flushing the channel with rapid flow. So the gravity driven solution requires valves that open and close very gently.

Stretching DNA

jumpcut movie:DNA stretching

Some promising results yesterday with trying to stretch DNA molecules. The molecule is attached between two microspheres, and we are actively moving the smaller sphere while the force acting on the bigger sphere is being measured. The image and video shows the view through a 100x microscope objective on the optical tweezers instrument I am building. Towards the end you can see the construct breaking in two stages, so that probably means there were two molecules of DNA between the beads and not one as intended. This is a control experiment and will hopefully set the stage for bigger and better things to come...

On SNR in single molecule experiments

ResearchBlogging.org

Wallin, A.E., Salmi, A., Tuma, R. (2007). Step Length Measurement--Theory and Simulation for Tethered Bead Constant-Force Single Molecule Assay. Biophysical Journal, 93(3), 795-805. DOI: 10.1529/biophysj.106.097915

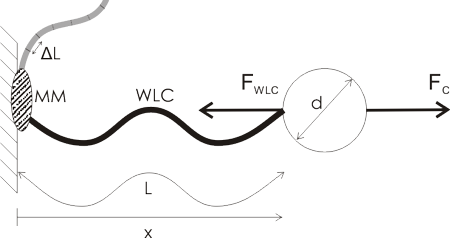
A lot of single molecule experiments are carried out in the configuration shown above. The idea is to mechanically probe a bio-molecule (such as DNA or RNA) or find out how an enzyme (such as RNAP) or a molecular motor (e.g. viral packaging motor) works. You either optically or magnetically trap a microsphere (the round thing with diameter d), which allows you to move it around, measure its position very accurately, and measure the forces acting on the sphere. The sphere is a big thing, usually 500 to 1000 nm in diameter, so it's easily visible in the microscope (the molecules themselves are not visible unless you label them with fluorescent tags).

Then you ask a biochemist in your lab to bind some useful stuff to the sphere. I've illustrated a hypothetical experiment where a molecular motor (MM, grey blob) is bound to the sample chamber wall, and the bead is tethered to the motor via a Worm-Like Chain (WLC, thick wavy line, a common model for polymers such as DNA/RNA).

The problem is that these things are tiny! People want to measure single steps for molecular motors, which can be as short as 0.3 nm. At the same time biological things also live at close to room temperature, so both the molecules and the microsphere are affected by random collisions from the solvent molecules.

Now the question is how small steps or changes in the WLC length are really measurable? It's a bit like going on a walk with your dog: imagine a very flexible string between the dog and yourself. Now if you pull only weakly on the string you can't expect to feel very much of the individual steps the dog takes, you just follow along smoothly while keeping the force approximately constant. If you really want to feel the individual steps you would use a stiffer string and pull much harder on it(but the dog would not like that...). Previous work such as that by Gittes and Schmidt and Moffitt et al. pretty much agrees that the Signal-to-Noise-Ratio (SNR) should look something like this:

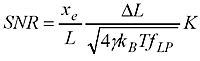
where you've used a force to stretch out the WLC (of length L) to an extension xe, the steps you are trying to detect are of size DeltaL, and the stiffness of the WLC is K. In the square root we have gamma (Stokes drag coefficient on the bead), Boltzmann's constant kb, temperature T, and f_lp the measurement bandwidth.

What do we need to do to get a high SNR (and thus measure short steps accurately) ? Use a large force (that increases xe and K), use small beads (that decreases gamma), cool down the lab (decrease T, but not so much so that your biology dies!), and measure slow moving stuff (low f_lp). But this formula is not so practical to use. You need to work out the extension xe yourself and also estimate the stiffness K somehow. I couldn't find anyone who had addressed how this works for common tethers such as DNA and RNA.

My (small) contribution to these thoughts is mainly working out how the SNR really depends on the properties of the WLC and the pulling force. I did a bit of simple theoretical analysis and showed with a Monte-Carlo simulation that the theoretical prediction is about right. This results in SNR 'maps' in parameter space that hopefully can guide experiments. For example if you suspect that your enzyme has a certain step length and you know your tether properties you can use the map or an approximate formula to work out the force you need to have a chance of measuring individual steps.