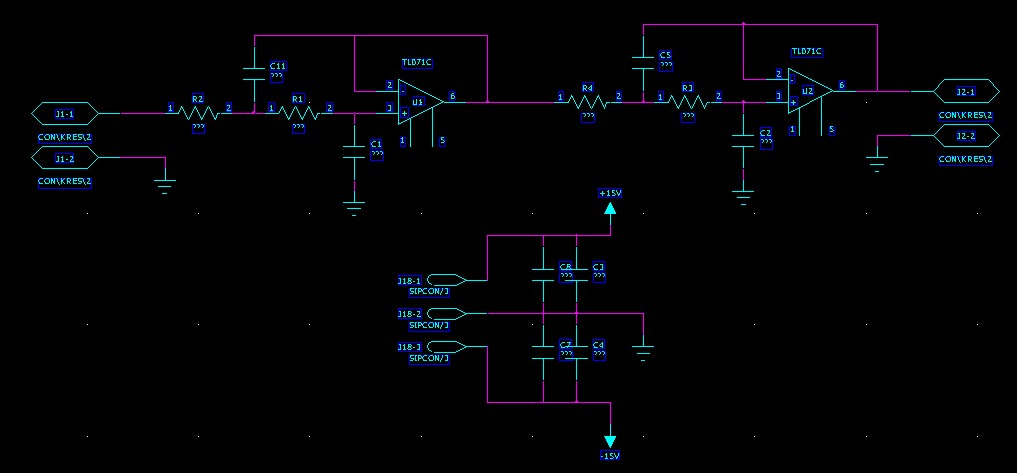
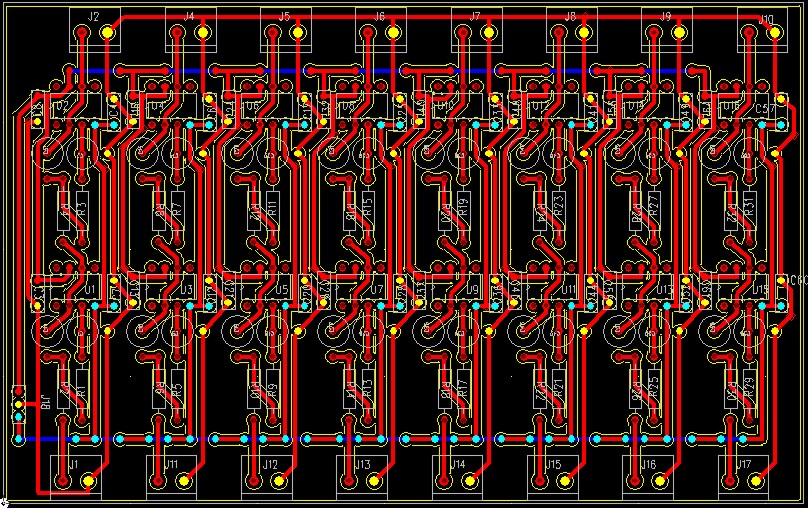
I used this Sallen-Key design to build an 8-channel 4th order low-pass anti-alias filter for a 16-bit 200 kS/s +/- 10 V AD-Converter. I calculated the components for the 60 kHz low-pass Butterworth design with this on-line calculator. Previously I've used the MAX274, but that component is limited to +/- 5 V signals. Here I really need the +/- 10 V voltage swing. The exact design calls for 2872 pF, 2452 pF, 6935 pF, and 1016 pF capacitors, but I looked at the transfer function with what values were available in 1% tolerance from Farnell, and the response looked fine with (R= 1 k, C1=C2= 2700 pF for the first stage and C1=6800 pF, C2=1000 pF for the second stage). Both the resistors and capacitors (~1.5 eur/pcs!) have a tolerance of 1 %, which according to a monte-carlo simulation should not affect the response that much. I'm using OP42 op-amps with a unity-gain bandwidth of 10 MHz, which should be adequate (100x the cut-off frequency was recommended in a guide I read, that would be 6 MHz in this case).
For testing I hooked up a signal generator and an oscilloscope and wrote a LabVIEW program to loop trough around 250 different frequencies while recording the peak-to-peak value of the filter input and output signals. The oscilloscope only has an 8-bit AD converter, but I adjusted the analogue gain between 5 V/div and 2 mV/div to achieve effectively around 16-bit dynamic range.
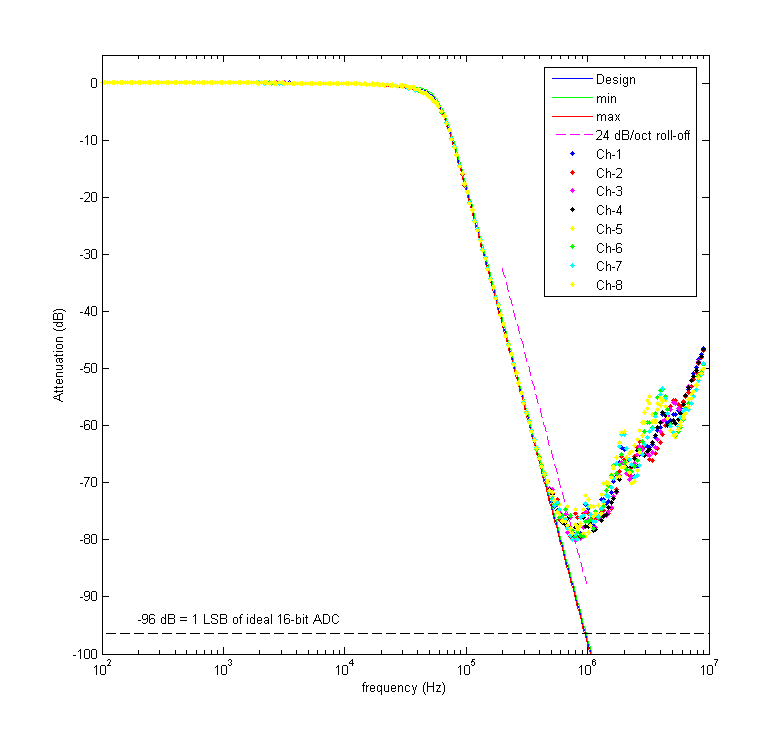
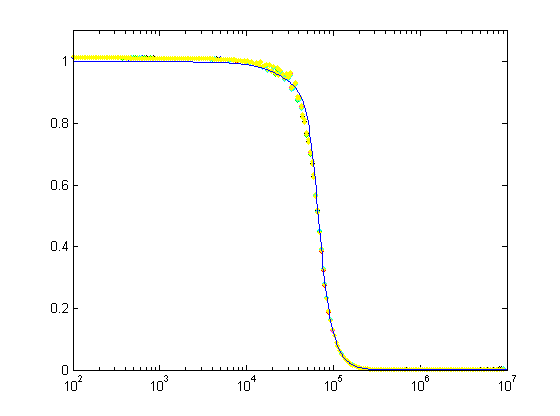
This is the result of testing all channels with a 20 Vpp sine wave between 100 Hz and 10 MHz. The blue curve shows the design response and the red and green curves show the maximum and minimum expected response from the monte-carlo simulation (I drew all component values from normal distributions with 1 % standard deviations). Pretty nice agreement until ~500 kHz. Here's another view of the data:
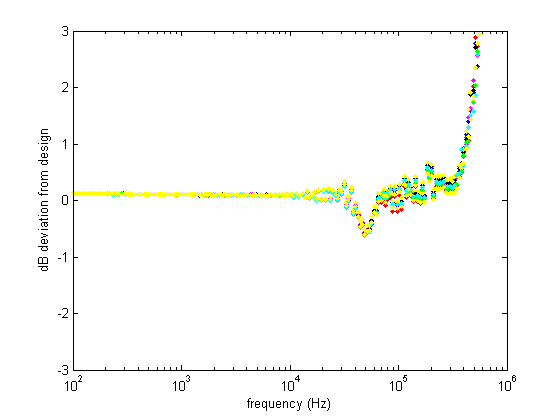
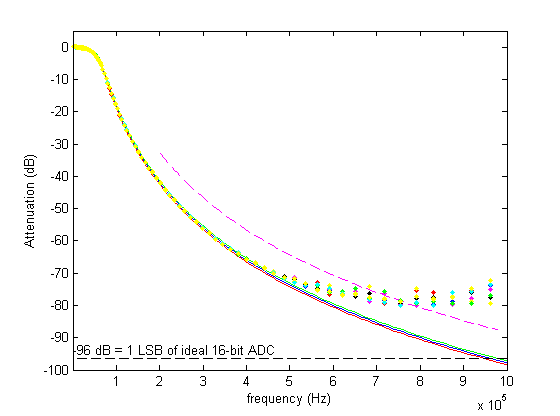
This figure shows the deviation of the real filters from the design response, again confirming that everything works as it should up to 500 kHz.
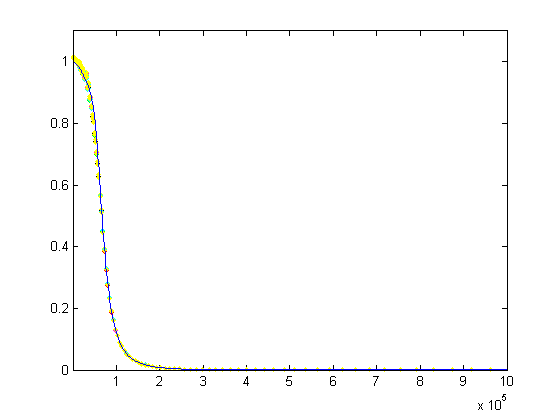
Log-log plots can be confusing, so here's a semilog plot and a linear plot of the same data:
Here are the source files for this design:
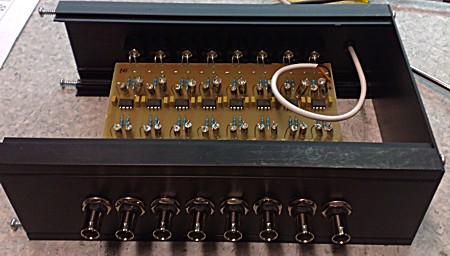
The box actually looks like this.