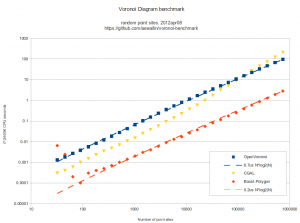
Here's some benchmark data for constructing the Voronoi diagram (or its dual, the Delaunay triangulation) for random point sites. Code for this benchmark is over here: https://github.com/aewallin/voronoi-benchmark
OpenVoronoi is my own effort using the incremental topology-oriented algorithm of Sugihara&Iri and Held. Floating-point coordinates with all sites falling within the unit-circle are used. Fast double-precision arithmetic is used for geometric predicates (e.g. "in-circle") during the incremental construction of the diagram, since the topology-oriented approach ensures that the algorithm finishes and produces an output graph regardless of errors in the geometric predicates. Quad-precision arithmetic is used for positioning vd-vertices. This benchmark runs in ca 7us*N*log2(N) time.
Boost.Polygon uses Fortune's sweepline algorithm. Only integer input coordinates are allowed, which ensures that geometric predicates can be computed exactly. Lazy arithmetic, where a high-precision slower number-type is used only when required, is used. This benchmark runs in ca 0.2us*N*log2(N) time.
CGAL uses exact geometric computation, which is slow but supposedly robust. The run-time gets worse with increasing problem-size and doesn't seem to fall on an O(N*log(N)) line.
Some thoughts:
- OpenVoronoi is obviously too slow! Lazy arithmetic or other methods are required so that most vd-vertices can be positioned with fast double-precision code, and the quad-precision methods need to be called only rarely. OpenVoronoi uses a BGL adjacency_list to store the graph - this may also be too slow compared to a C-style "raw" data structure.
- Other libraries which might be added to the benchmark: Triangle and QHull.
- Held has, IIRC, reported around 0.5us*N*log2(N) for his closed-source VRONI algorithm. From the interwebs we also find this quote: "If your use is commercial, VRONI's license is a few thousand dollars."
- It's easy to measure run-time, but how do we measure the correctness of the output that these algorithms produce? A first simple approach is write the output to a PNG or SVG file and visually inspect it, but something more precise and automated would be nice.
- Neither Boost.Polygon nor OpenVoronoi support circular arc sites yet. Both can in principle be extended to do so.
- Are we comparing apples to oranges? Is the output of these algorithms the same? OpenVoronoi produces a half-edge data structure of the diagram with edge-parametrizations (lines, parabolas) that allow computing a point on an edge at a given offset-distance from an adjacent site. The data structure allows for iterating through the edges, vertices, and faces of the graph.
